From Friday, April 19th (11:00 PM CDT) through Saturday, April 20th (2:00 PM CDT), 2024, ni.com will undergo system upgrades that may result in temporary service interruption.

We appreciate your patience as we improve our online experience.

Example Code

Programmatically Set A Graph Scale To Linear Or Log

Products and Environment

This section reflects the products and operating system used to create the example.

To download NI software, including the products shown below, visit ni.com/downloads.

    Software

  • LabVIEW

Code and Documents

Attachment

Overview

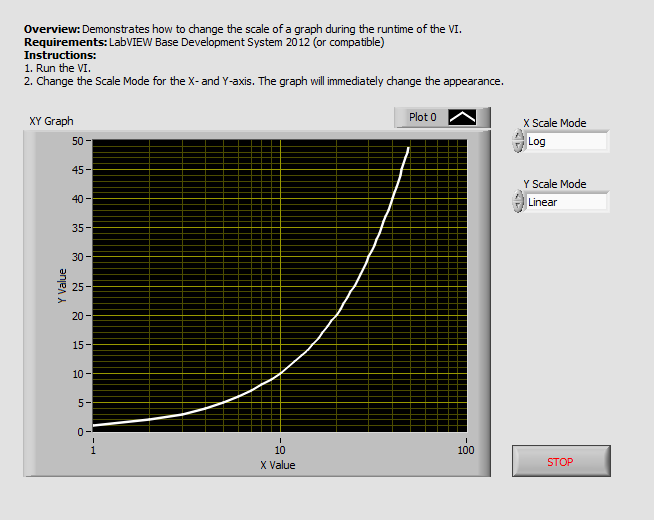
This example shows how you can use a graph property node to set a linear or log scale.


Description

LabVIEW offers options to configure the scale of a graph to a linear or log scale. It is possible to configure this static trough the LabVIEW-IDE, but it is also possible to change the scale during the execution of the VI.

This example demonstrates how to change the scale during the execution of the VI.


Requirements

 Software

  • LabVIEW Full Development System 2012 (or compatible)
  • If running in a Real-Time context, you will need the LabVIEW Real-Time Module 2012 (or compatible)

 Hardware

  • No hardware is necessary to use this example VI


Steps to Implement or Execute Code

  1. Download and open the attached VI
  2. Run the program


Additional Information or References Change Graph Scale During Runtime - Front Panel.png
 

Change Graph Scale During Runtime - Block Diagram.png


**The code for this example has been edited to meet the new Community Example Style Guidelines. The edited copy is marked with the text ‘NIVerified’. Read here for more information about the new Example Guidelines and Community Platform.**

Example code from the Example Code Exchange in the NI Community is licensed with the MIT license.