Introduction
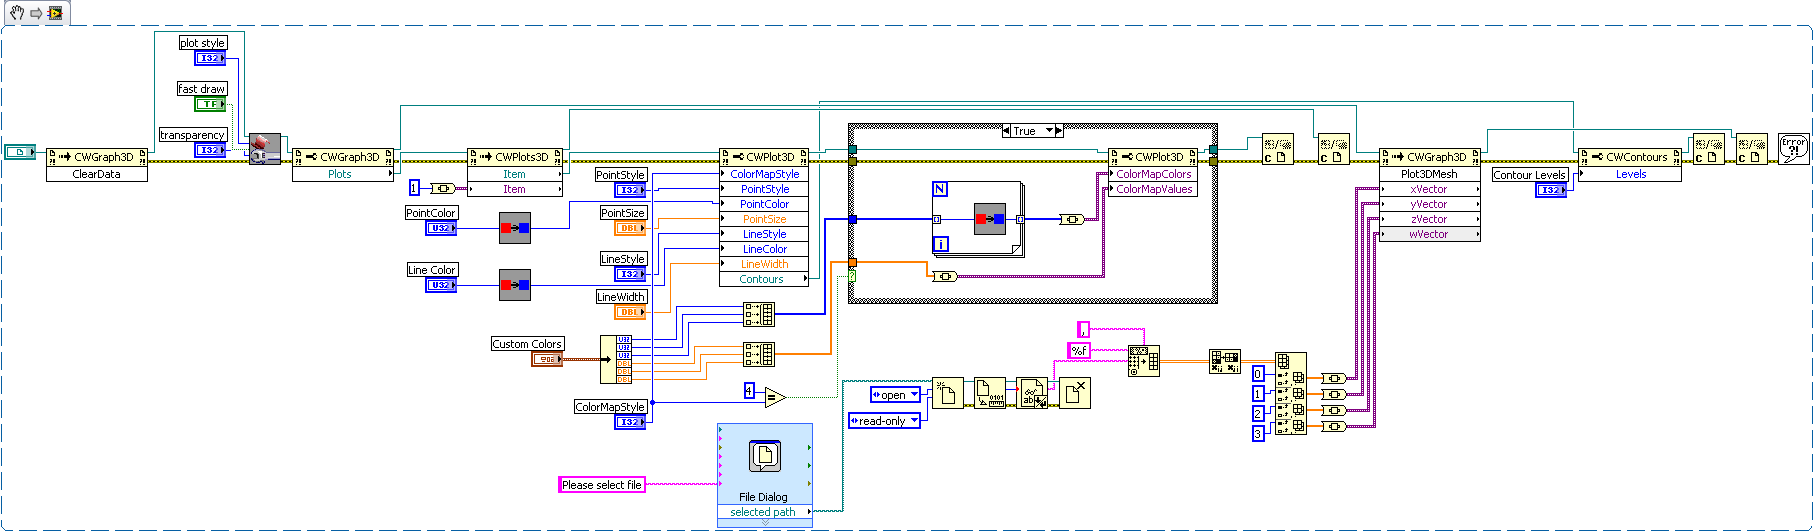
The following example takes the data form a data file (t,x,y,z). The data was collected form a three axis accelerometer with respect to time. (t,x,y) will be graphed in a 3D coordinate, and the Z value will be expressed in color intensity for each point. The graph will give you the flexibility in choosing the colors, surfaces, lines and so on.