- Document History
- Subscribe to RSS Feed
- Mark as New
- Mark as Read
- Bookmark
- Subscribe
- Printer Friendly Page
- Report to a Moderator
- Subscribe to RSS Feed
- Mark as New
- Mark as Read
- Bookmark
- Subscribe
- Printer Friendly Page
- Report to a Moderator
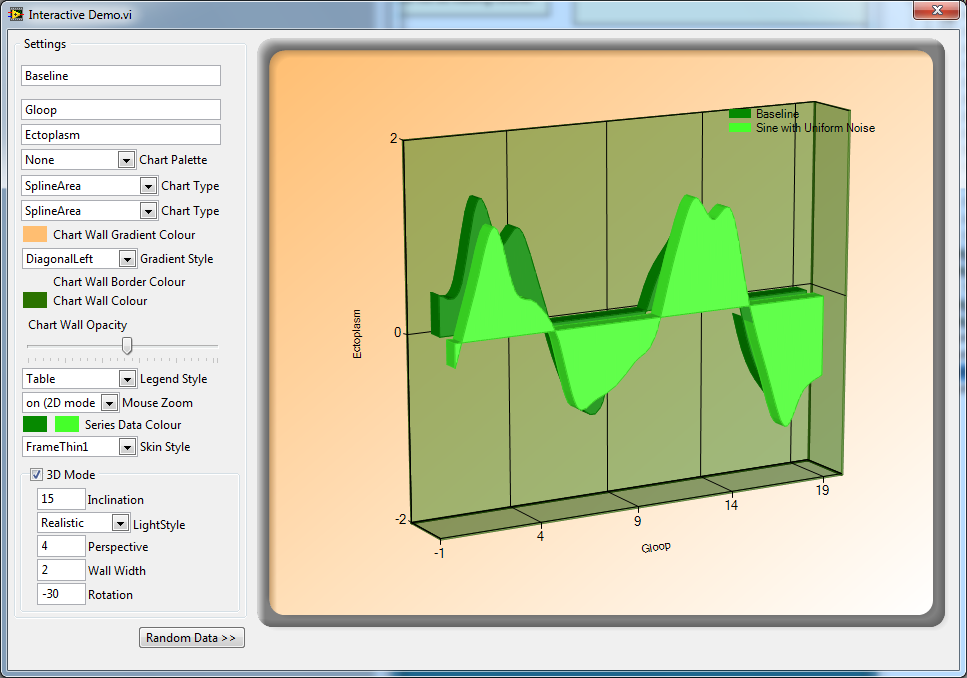
Following the demonstration of the Microsoft .NET Chart control in a previous document (here), I was challenged to create a more user friendly XControl. It's taken some time (we're all busy people) but here's the first draft!
Attached is an XControl that encapsulates a Microsoft .NET Chart. Properties have been created to allow setting of parameters and an Interactive Demo is included to show how easy it is to implement the XControl.
You'll need the Microsoft Charts toolkit, which is a very small download and absolutely free (download link).
The XControl is at V0.1 and therefore not finished yet, but most of the basic functionality is there. Currently you can:
- Set the names and axes labels (the Interactive Demo currently only allows setting the first data series)
- Add as many data series as you want (the XControl uses the LabVIEW waveform datatype, which is arrayed)
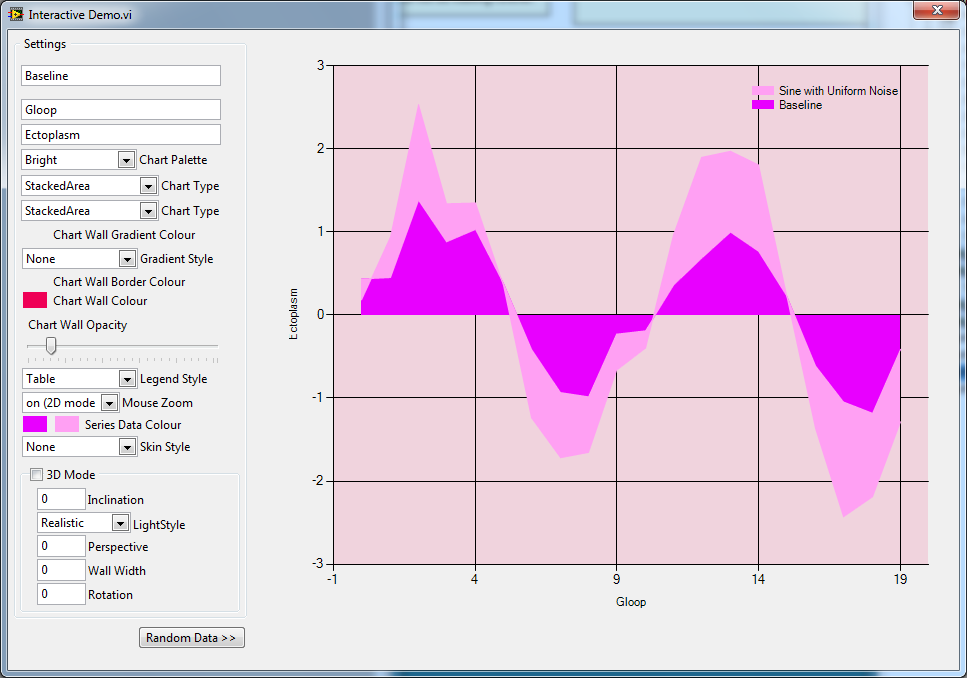
- Change the plot type from Line to Spline to Bar to Area to Donut to Stacked Area 100 etc. etc. etc.
- Switch between 2D and 3D plotting (in 3D plotting, you can alter the Inclination, Rotation, Perspective etc.)
- Change the colours of the series lines, backgrounds etc.
- Change the border style (none, embossed, recessed, framed etc.)
- Add a legend, and change (some of) its properties
- Zoom and Pan with the mouse (in 2D mode only - a Microsoft limitation)
If you like the XControl, please leave a comment with suggestions on how to improve it.
It is a working progress, and as such cannot be assumed to be stable or reliable, so I wouldn't necessarily recommend you use it for a mission-critical project! But with progress, it could become something very useful indeed 
V0.1 Known problems:
- Some plot types cannot be mixed (such as Bar and Spline), so if you keep more than one series plotted (such as in the Interactive Demo), the XControl fails if you try to set unpairable plot types
- There are some colour options that need tweaking - there are soooo many parameters in the Microsoft Chart control that I got lost, so they're not all accessible yet.
- For some unknown reason, the opacity control sometime gets ignored when the plot is redrawn.


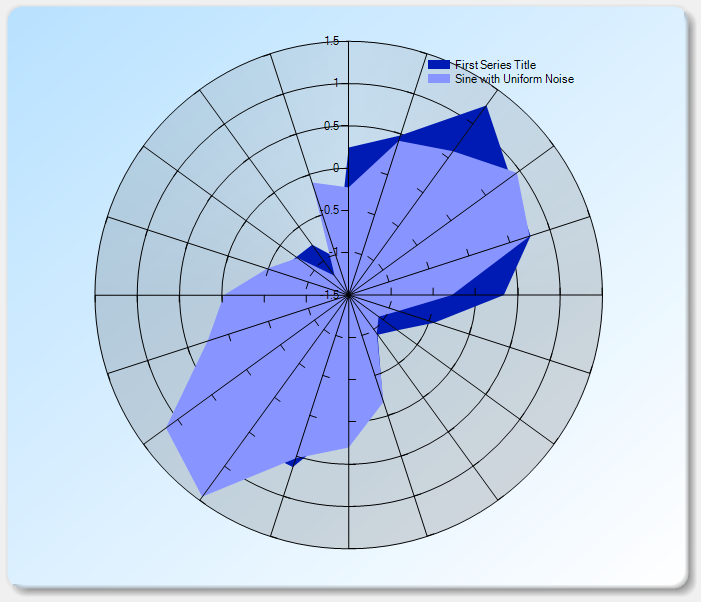
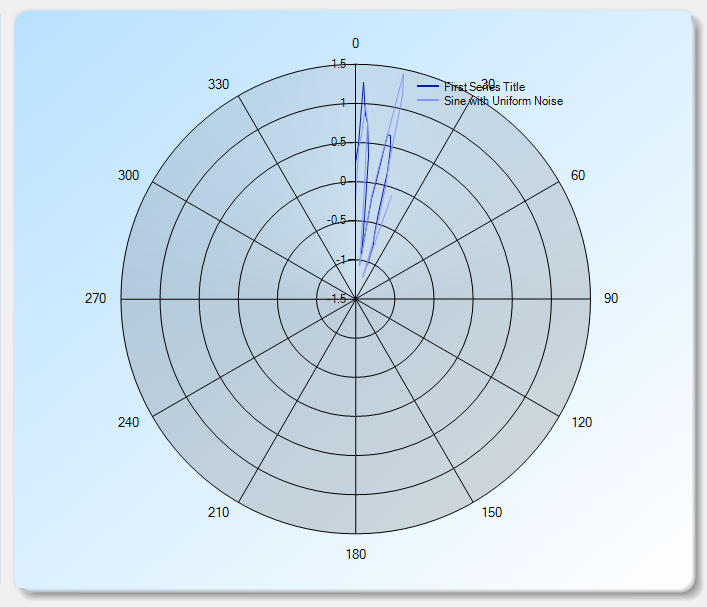
Two more snapshots showing radar and polar plot modes (Note: I didn't use the Interactive Demo V0.1 to generate these)
- Mark as Read
- Mark as New
- Bookmark
- Permalink
- Report to a Moderator
Hi! This looks great, however I just tried to open the Interactive Demo.vi and a certain dependency is missing... System.Forms.DataVisualization.dll. I have Windows7 and VS9, is there a toolkit for these charts that i need to install?
- Mark as Read
- Mark as New
- Bookmark
- Permalink
- Report to a Moderator
Hi ali66b,
Yes, my apologies. You need the Microsoft Chart toolkit, which is a very small download and absolutely free (direct download link).
I referenced this originally in my Microsoft Charts In LabVIEW document, but forgot to include it here.
- Mark as Read
- Mark as New
- Bookmark
- Permalink
- Report to a Moderator
Yep.. works now! Thanks
Alex
- Mark as Read
- Mark as New
- Bookmark
- Permalink
- Report to a Moderator
This looks really cool. I can't wait to try it out.
- Mark as Read
- Mark as New
- Bookmark
- Permalink
- Report to a Moderator
Thoric,
You've outdone yourself again! I truly appreciate anyone who breaks the ice with new LabVIEW - .NET applications. I currently have a need for using your XControl via either the Radar or Polar chart type - but only with one (1) channel of data displayed. Is this possible with the current XControl functionality ? Thank you.
- Mark as Read
- Mark as New
- Bookmark
- Permalink
- Report to a Moderator
Hi KarlH, and thanks for the kudos!
Yes, Radar and Polar plots can be done with the XControl, but not in the Interactive Demo (V0.1) as there's a little bug with the plot mode ringlist. I'm working on improving the demo to allow you to control these parameters better.
I've added two snapshots to show the radar plot and polar plot modes, each showing two channels but you can plot just one of course.
.
- Mark as Read
- Mark as New
- Bookmark
- Permalink
- Report to a Moderator
Very nice, Thoric! I think it is time to invest some effort on my part to learn X-controls!
That being said - as a dumb user I did manage to throw an unhandled exception that forced me to have to actually close the demo and reopen it (I tried to use a column and pie chart simultaneously).
- Mark as Read
- Mark as New
- Bookmark
- Permalink
- Report to a Moderator
Hi Matt,
Yes, XControls can be very powerful! I acknowledge that my Interactive Demo has flaws, and setting the two plots to use conflicting types causes a .NET exception that can't be recovered. One has to close down the demo completely and reload it 
Ideally the software would allow the user to change the plot types together to prevent the clash. I'm working on updating the Demo to make this possible
- Mark as Read
- Mark as New
- Bookmark
- Permalink
- Report to a Moderator
Jeez, Thoric! Whadaya have a day job or something?! 
- Mark as Read
- Mark as New
- Bookmark
- Permalink
- Report to a Moderator
Hi there. Well done. Is it possible to use this control as an X-Y graph?
- Mark as Read
- Mark as New
- Bookmark
- Permalink
- Report to a Moderator
Yes, it most certainly can. Use the Point chart style for (X,Y) data.
In my demo, I generate random signals with monotonic x data, but it can easily accept a vector of X values and another of Y values (they need to be bundled into a LabVIEW Waveform datatype for the XControl)
There's also a FastPoint chart style, presumably for rapid updating or large datasets.
- Mark as Read
- Mark as New
- Bookmark
- Permalink
- Report to a Moderator
I'm no familiar with using waveform datatype but that only has Y and dt (constant). I want X vs Y. Can you post an image on how to form the necessary datatype? Very basic question I know. Much appreciated.
- Mark as Read
- Mark as New
- Bookmark
- Permalink
- Report to a Moderator
Also, how do you add/remove data series? When I wire my own data to the control terminal I still see the second random data series and in the legend. Can all the data series be reset?
- Mark as Read
- Mark as New
- Bookmark
- Permalink
- Report to a Moderator
Hi battler,
I also am not very familiar with LV waveform datatype, I selected to adopt it here because it allows multiple charts in one control (without resorting to using arrays - which might confuse basic users who want to plot a single chart). It may be you are right and that one cannot create a waveform datatype that contains independent X and Y values! This is a problem, and a limitation of NI's datatype I wasn't aware of  . I've taken a quick look and cannot see a way around this right now. It may be I have to abandon the Waveform Datatype in favour of something else? (Gentle prod for suggestions from people)
On your second note, the XControl is supposed to delete an unwanted series from the chart when you input only one series. Clearly this isn't working. I'm looking at fixing this now...
- Mark as Read
- Mark as New
- Bookmark
- Permalink
- Report to a Moderator
Thoric, what about an array of cluster of x and y arrays. This is versatile as both x and y and dt (constant steps in y array) can be used. I think anyone wishing to use an x control and .NET should be familiar with arrays and these techniques. Nice work!
- Mark as Read
- Mark as New
- Bookmark
- Permalink
- Report to a Moderator
Hi battler,
Yes, I'm currently turning the internal data storage buffer into an array of clusters of x and y arrays, which is what the LV XYgraph accepts for multiple plots. However, I still want to avoid using an arrayed datatype for the indicator terminal because I know an array of a cluster of arrays can be bamboozling for newbies (I was there once myself!). So instead I'm wondering if I open up access to the internal data buffers through more property nodes (such as Active Series, X Data, Y Data), then one could programmatically populate the XControl when needing an XY plot. An obvious downside for newbie users, but does allow more functionality. We'll see how the development goes - I hope to have something for release soon...
- Mark as Read
- Mark as New
- Bookmark
- Permalink
- Report to a Moderator
Hi everybody, Thoric are there any chances to have this for LabVIEW version 8.5?
- Mark as Read
- Mark as New
- Bookmark
- Permalink
- Report to a Moderator
Hi uxpro - I'll see what I can do this week for you.
Update - I've created a V8.6 release, but not tested it. I hope it works for you!
- Mark as Read
- Mark as New
- Bookmark
- Permalink
- Report to a Moderator
Thanks a lot, Do you plan to go further with this Topic?
- Mark as Read
- Mark as New
- Bookmark
- Permalink
- Report to a Moderator
You're welcome uxpro.
Yes, I still plan to advance this control, but I've been working on a few other little personal projects recently. I never have enough spare time to finish anything it seems!
- Mark as Read
- Mark as New
- Bookmark
- Permalink
- Report to a Moderator
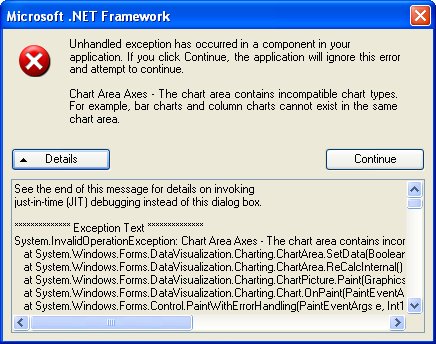
Very impressive. I tried it in LV 2010 SP1 and got the following .NET Framework error when trying the StackedBar style:
- Mark as Read
- Mark as New
- Bookmark
- Permalink
- Report to a Moderator
Hi, yes, although the XControl supports StackedBar styles, the Interactive Demo causes a problem. The stackedbar style cannot be combined with other styles, but the interactive demo will only let you change one plot line style at a time, so as soon as you change the first to StackedBar it causes a .NET Chart control error.
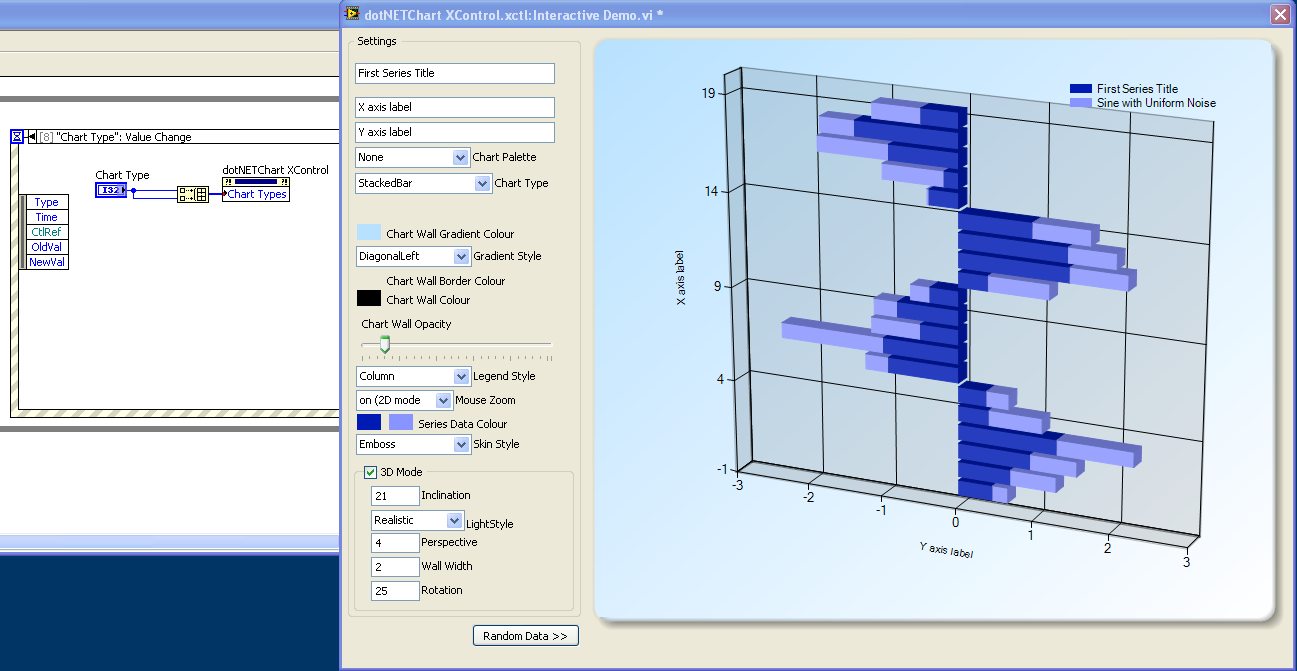
The solution is to either change the interactive demo to set both line styles simultaneously by deleting the second ChartType control wiring to first to both array builder inputs in the "Chart Type:Value Change" event case (see snapshot below), or just avoid the interactive demo and play around with the XControl in your own VI
- Mark as Read
- Mark as New
- Bookmark
- Permalink
- Report to a Moderator
Nice work here. You might consider splitting the xcontrol along the lines of the waveform graph and xy graph, i.e, make two xcontrols with bascially the same backend but with different input types. It's hard to make a single type to handle all graph types.
- Mark as Read
- Mark as New
- Bookmark
- Permalink
- Report to a Moderator
Great job! I am very excited to see better looking plots are obtainable in labview. Is there a way to modify the scaling of the x and y axis? I have an array of numbers that I want to enter into the x and y axis but I can not figure out which VI will give me access.
Thanks.
- Mark as Read
- Mark as New
- Bookmark
- Permalink
- Report to a Moderator
Hi Robin,
Thanks. The Microsoft chart dll is very customisable so, although I'm not at a computer right now to check, I'm fairly confident it can be done. Check property options for the scales, if you can figure it though I'll take a look tomorrow...
- Mark as Read
- Mark as New
- Bookmark
- Permalink
- Report to a Moderator
Hi Thoric !
Nice job withe the MS Charts !
Currently manipulating them, I'm facing a small problem : did you fin a way to have the back color transparent ?
In my case, I can't get my VI background visible. It always stays grey even if I set the Chart.BackColor to Color.Transparent.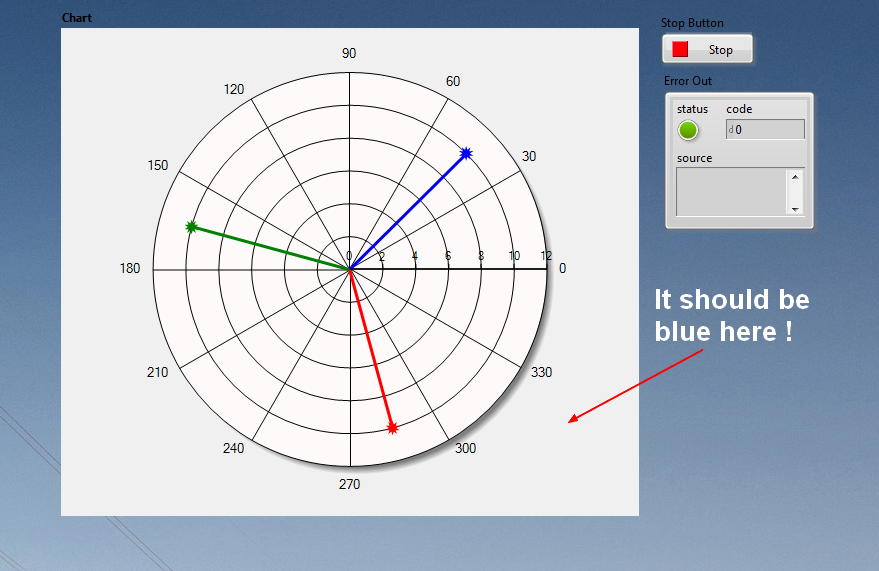
- Mark as Read
- Mark as New
- Bookmark
- Permalink
- Report to a Moderator
Hi zyl7! Nice idea with the transparency, I can't recall trying that myself. If I get a chance I'll take a look later. If you figure it out let me know!
- Mark as Read
- Mark as New
- Bookmark
- Permalink
- Report to a Moderator
OK, so I've been looking into this and it appears that the LabVIEW .NET Container object doesn't honour the transparency of the contained .NET class instance. Therefore, although you can set a transparent background within the Chart control, LabVIEW shows this as a region of grey. Maybe one for the Idea Exchange?
- Mark as Read
- Mark as New
- Bookmark
- Permalink
- Report to a Moderator
Great Work, Thoric!
Is there a way to register events with .NET charts?
- Mark as Read
- Mark as New
- Bookmark
- Permalink
- Report to a Moderator
LVCoder wrote:
Is there a way to register events with .NET charts?
You have to register callback VIs when using .NET events: https://decibel.ni.com/content/docs/DOC-9161
- Mark as Read
- Mark as New
- Bookmark
- Permalink
- Report to a Moderator
LVCoder wrote:
Great Work, Thoric!
Is there a way to register events with .NET charts?
Yes, I use .NET callbacks in my LabVIEW Speech Synthesis demo, use this as a guide (as well as David's link) to learn more. (This presume the Microsoft Charts have any events to register in the first place?)
- Mark as Read
- Mark as New
- Bookmark
- Permalink
- Report to a Moderator
Thanks for the links!
I was looking for a maker property on a data point to make it movable, but couldn't find it. I believe I'll have to programatically change it's position using .NET events.
And, Yes, MS Charts have events to register.
- Mark as Read
- Mark as New
- Bookmark
- Permalink
- Report to a Moderator
Hi Thoric,
This is Excellent...! Could you please, guide me how to plot Polar Plot.
- Mark as Read
- Mark as New
- Bookmark
- Permalink
- Report to a Moderator
Wow this is cool. Hopefully NI incoporates this into LabVIEW. Leverging the Microsoft Charts is very cool!
Dan Shangraw, P.E.
- Mark as Read
- Mark as New
- Bookmark
- Permalink
- Report to a Moderator
Anyone having problems running this in Labview 2014 with dotnet 4.0? When I select box plot it seems to crash.....
When loading the Xcontrol, it reports 5 warnings about the dot net assembly being 4.0 instead of 3.5.....
- Expected Assembly "System.Windows.Forms.DataVisualization, Version=3.5.0.0, Culture=neutral, PublicKeyToken=31bf3856ad364e35", but found "System.Windows.Forms.DataVisualization, Version=4.0.0.0, Culture=neutral, PublicKeyToken=31bf3856ad364e35."
Thanks!
- Mark as Read
- Mark as New
- Bookmark
- Permalink
- Report to a Moderator
It loads in my LabVIEW 2014 without any crashes. I have .NET 4.5.2 version.
Ajay MV
