-
NI Community
- Welcome & Announcements
-
Discussion Forums
- Most Active Software Boards
- Most Active Hardware Boards
-
Additional NI Product Boards
- Academic Hardware Products (myDAQ, myRIO)
- Automotive and Embedded Networks
- DAQExpress
- DASYLab
- Digital Multimeters (DMMs) and Precision DC Sources
- Driver Development Kit (DDK)
- Dynamic Signal Acquisition
- FOUNDATION Fieldbus
- High-Speed Digitizers
- Industrial Communications
- IF-RIO
- LabVIEW Communications System Design Suite
- LabVIEW Electrical Power Toolkit
- LabVIEW Embedded
- LabVIEW for LEGO MINDSTORMS and LabVIEW for Education
- LabVIEW MathScript RT Module
- LabVIEW Web UI Builder and Data Dashboard
- MATRIXx
- Hobbyist Toolkit
- Measure
- NI Package Manager (NIPM)
- Phase Matrix Products
- RF Measurement Devices
- SignalExpress
- Signal Generators
- Switch Hardware and Software
- USRP Software Radio
- NI ELVIS
- VeriStand
- NI VideoMASTER and NI AudioMASTER
- VirtualBench
- Volume License Manager and Automated Software Installation
- VXI and VME
- Wireless Sensor Networks
- PAtools
- Special Interest Boards
- Community Documents
- Example Programs
-
User Groups
-
Local User Groups (LUGs)
- Denver - ALARM
- Bay Area LabVIEW User Group
- British Columbia LabVIEW User Group Community
- Chicago LabVIEW User Group
- Egypt NI Chapter
- GUNS
- Houston Area LabVIEW Community
- LabVIEW - University of Applied Sciences Esslingen
- [IDLE] LabVIEW User Group Stuttgart
- LUGG - LabVIEW User Group at Goddard
- LUGNuts: LabVIEW User Group for Connecticut
- Madison LabVIEW User Group Community
- Mass Compilers
- Melbourne LabVIEW User Group
- Midlands LabVIEW User Group
- Milwaukee LabVIEW Community
- Minneapolis LabVIEW User Group
- CSLUG - Central South LabVIEW User Group (UK)
- Nebraska LabVIEW User Community
- New Zealand LabVIEW Users Group
- NI UK and Ireland LabVIEW User Group
- NOCLUG
- Orange County LabVIEW Community
- Ottawa and Montréal LabVIEW User Community
- Washington Community Group
- Phoenix LabVIEW User Group (PLUG)
- Politechnika Warszawska
- PolŚl
- Rutherford Appleton Laboratory
- Sacramento Area LabVIEW User Group
- San Diego LabVIEW Users
- Sheffield LabVIEW User Group
- South East Michigan LabVIEW User Group
- Stockholm LabVIEW User Group (STHLUG)
- Southern Ontario LabVIEW User Group Community
- SoWLUG (UK)
- Space Coast Area LabVIEW User Group
- Sydney User Group
- Top of Utah LabVIEW User Group
- Utahns Using TestStand (UUT)
- UVLabVIEW
- Western NY LabVIEW User Group
- Western PA LabVIEW Users
- Orlando LabVIEW User Group
- Aberdeen LabVIEW User Group (Maryland)
- Gainesville LabVIEW User Group
- LabVIEW Team Indonesia
- Ireland LabVIEW User Group Community
- Louisville KY LabView User Group
- NWUKLUG
- LVUG Hamburg
- LabVIEW User Group Munich
- LUGE - Rhône-Alpes et plus loin
- London LabVIEW User Group
- VeriStand: Romania Team
- DutLUG - Dutch LabVIEW Usergroup
- WaFL - Salt Lake City Utah USA
- Highland Rim LabVIEW User Group
- NOBLUG - North Of Britain LabVIEW User Group
- North Oakland County LabVIEW User Group
- Oregon LabVIEW User Group
- WUELUG - Würzburg LabVIEW User Group (DE)
- LabVIEW User Group Euregio
- Silesian LabVIEW User Group (PL)
- Indian LabVIEW Users Group (IndLUG)
- West Sweden LabVIEW User Group
- Advanced LabVIEW User Group Denmark
- Automated T&M User Group Denmark
- UKTAG – UK Test Automation Group
- Budapest LabVIEW User Group (BudLUG)
- South Sweden LabVIEW User Group
- GLA Summit - For all LabVIEW and TestStand Enthusiasts!
- Bangalore LUG (BlrLUG)
- Chennai LUG (CHNLUG)
- Hyderabad LUG (HydLUG)
- LUG of Kolkata & East India (EastLUG)
- Delhi NCR (NCRLUG)
- Montreal/Quebec LabVIEW User Group Community - QLUG
- Zero Mile LUG of Nagpur (ZMLUG)
- LabVIEW LATAM
- LabVIEW User Group Berlin
- WPAFB NI User Group
- Rhein-Main Local User Group (RMLUG)
- Huntsville Alabama LabVIEW User Group
- LabVIEW Vietnam
- [IDLE] ALVIN
- [IDLE] Barcelona LabVIEW Academic User Group
- [IDLE] The Boston LabVIEW User Group Community
- [IDLE] Brazil User Group
- [IDLE] Calgary LabVIEW User Group Community
- [IDLE] CLUG : Cambridge LabVIEW User Group (UK)
- [IDLE] CLUG - Charlotte LabVIEW User Group
- [IDLE] Central Texas LabVIEW User Community
- [IDLE] Cowtown G Slingers - Fort Worth LabVIEW User Group
- [IDLE] Dallas User Group Community
- [IDLE] Grupo de Usuarios LabVIEW - Chile
- [IDLE] Indianapolis User Group
- [IDLE] Israel LabVIEW User Group
- [IDLE] LA LabVIEW User Group
- [IDLE] LabVIEW User Group Kaernten
- [IDLE] LabVIEW User Group Steiermark
- [IDLE] தமிழினி
- Swiss LabVIEW Embedded User Group
- Academic & University Groups
-
Special Interest Groups
- Actor Framework
- Biomedical User Group
- Certified LabVIEW Architects (CLAs)
- DIY LabVIEW Crew
- LabVIEW APIs
- LabVIEW Champions
- LabVIEW Development Best Practices
- LabVIEW Web Development
- NI Labs
- NI Linux Real-Time
- NI Tools Network Developer Center
- UI Interest Group
- VI Analyzer Enthusiasts
- [Archive] Multisim Custom Simulation Analyses and Instruments
- [Archive] NI Circuit Design Community
- [Archive] NI VeriStand Add-Ons
- [Archive] Reference Design Portal
- [Archive] Volume License Agreement Community
- 3D Vision
- Continuous Integration
- G#
- GDS(Goop Development Suite)
- GPU Computing
- Hardware Developers Community - NI sbRIO & SOM
- JKI State Machine Objects
- LabVIEW Architects Forum
- LabVIEW Channel Wires
- LabVIEW Cloud Toolkits
- Linux Users
- Unit Testing Group
- Distributed Control & Automation Framework (DCAF)
- User Group Resource Center
- User Group Advisory Council
- LabVIEW FPGA Developer Center
- AR Drone Toolkit for LabVIEW - LVH
- Driver Development Kit (DDK) Programmers
- Hidden Gems in vi.lib
- myRIO Balancing Robot
- ROS for LabVIEW(TM) Software
- LabVIEW Project Providers
- Power Electronics Development Center
- LabVIEW Digest Programming Challenges
- Python and NI
- LabVIEW Automotive Ethernet
- NI Web Technology Lead User Group
- QControl Enthusiasts
- Lab Software
- User Group Lead Network
- CMC Driver Framework
- JDP Science Tools
- LabVIEW in Finance
- Nonlinear Fitting
- Git User Group
- Test System Security
- Product Groups
- Partner Groups
-
Local User Groups (LUGs)
-
Idea Exchange
- Data Acquisition Idea Exchange
- DIAdem Idea Exchange
- LabVIEW Idea Exchange
- LabVIEW FPGA Idea Exchange
- LabVIEW Real-Time Idea Exchange
- LabWindows/CVI Idea Exchange
- Multisim and Ultiboard Idea Exchange
- NI Measurement Studio Idea Exchange
- NI Package Management Idea Exchange
- NI TestStand Idea Exchange
- PXI and Instrumentation Idea Exchange
- Vision Idea Exchange
- Additional NI Software Idea Exchange
- Blogs
- Events & Competitions
- Optimal+
- Regional Communities
- NI Partner Hub
-
 Maynimation
on:
Check out How-to documents for the new LabVIEW Biomedical Toolkit
Maynimation
on:
Check out How-to documents for the new LabVIEW Biomedical Toolkit
-
 ZJ.Gu
on:
Announcing the LabVIEW 2012 Biomedical Toolkit
ZJ.Gu
on:
Announcing the LabVIEW 2012 Biomedical Toolkit
- Newton_de_Faria on: Snooping on your brain
-
 Sundar...
on:
New LabVIEW drivers for low-cost EEG headsets
Sundar...
on:
New LabVIEW drivers for low-cost EEG headsets
-
Steve.J
on:
The Fastest Growing Engineering Degree
-
Steve.J
on:
Join us at BMES 2010
-
Steve.J
on:
Using the "Wiimote" Controller in Biomedical Research
-
GeoffJo
on:
Great "hidden" FDA training resources
-
 Coq_Rouge
on:
The NI licence policy exclude the "Touch Panel Module" from use in the medical segment
Coq_Rouge
on:
The NI licence policy exclude the "Touch Panel Module" from use in the medical segment
-
Steve.J
on:
Where would you like to see NI go in the life sciences?
Acquire and analyze synchronized video and waveform data
- Subscribe to RSS Feed
- Mark as New
- Mark as Read
- Bookmark
- Subscribe
- Printer Friendly Page
- Report to a Moderator
I had an opportunity recently to visit the Marine Biological Laboratory at the Woods Hole Oceanographic Institute on Cape Cod. National Instruments has supported the work at this prestigious lab over the years with equipment and software donations, so it was great to see our tools being used in cutting edge research. The fun part about the summer program at Woods Hole is that researchers from around the world come to teach some of the newest techniques for making neurophysiological measurements. One of the technical themes that I noticed from these visits is the increasing use of coordinated (ideally tightly synchronized) video and waveform data. In some cases, the goal is to correlate the behavior of an organism to controlled stimulus in its environment, or with measurements of nerve or muscle activity within the organism itself. In other cases, images of tissue or cells (perhaps using fluorescent dyes) are acquired while cells are excited chemically or electrically. The variety is endless. In one amazing example (technique taught by Michael Dickinson from CalTech) the images of the wings of a fruit fly are acquired while recording from the "brain" of the fly while it is presented with a variety of visual stimuli.
Since timing and synchronization have always been a hallmark of NI's data acquisition technology, this kind of tightly synchronized video and measurement task is very simple when using image acquisition boards (analog or digital Cameralink) since the image acquisition board can be setup to drive the sample clock of the DAQ board using RTSI. There is no need to create triggers to start and stop video acquisition and hope that during post-acquisition analysis you can line up the two data streams - click here for example code.
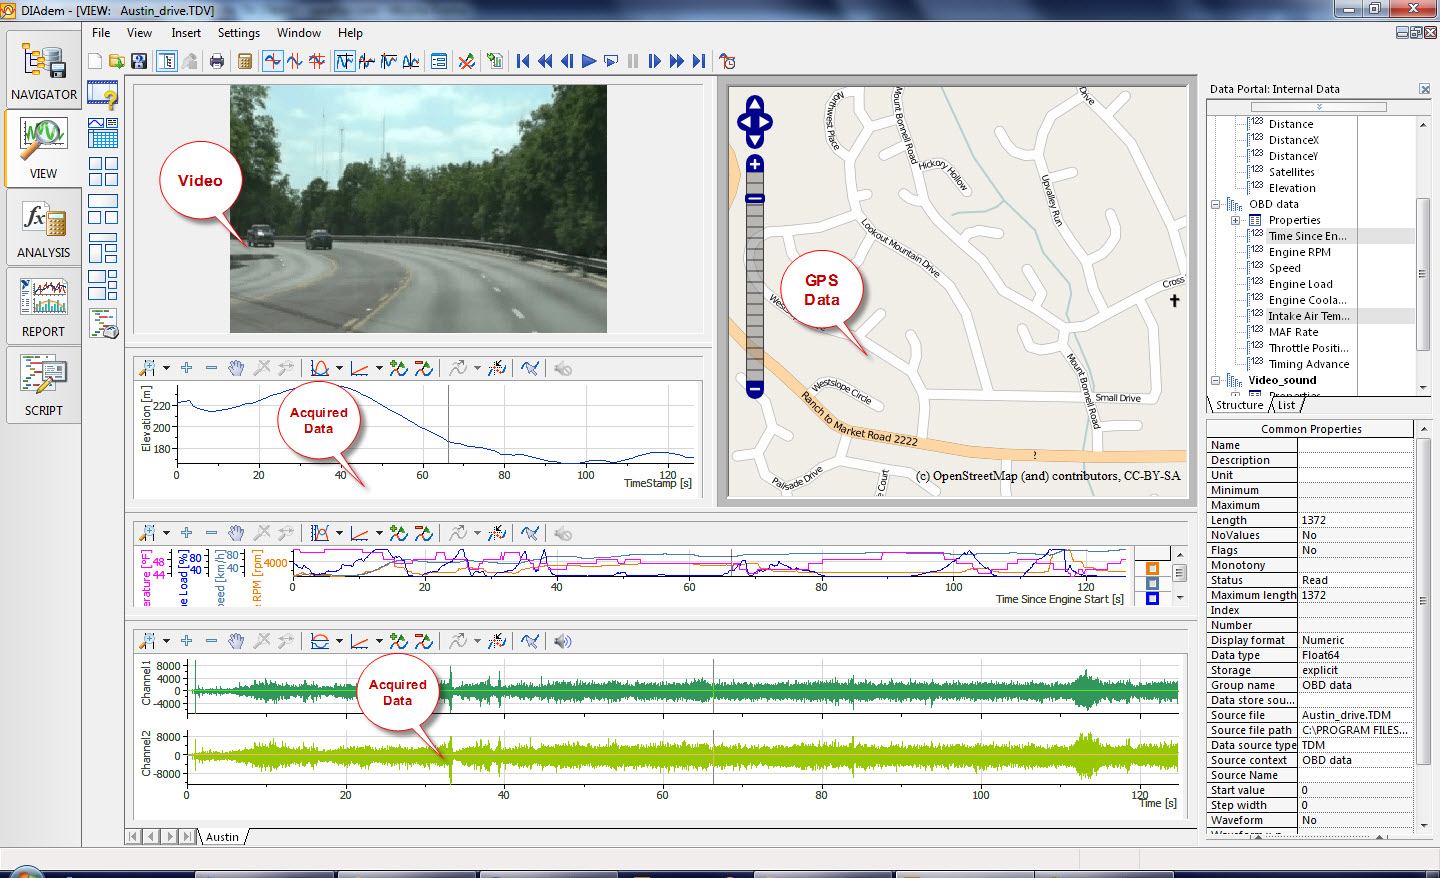
Even better - with NI DIAdem you can easily move through hours of video and waveform data collected using LabVIEW and do it easily all in the same environment without any programming. Check out this screenshot, which shows automobile vehicle data (like RPM, engine temperature, ignition timing parameters, etc.) as waveforms while cockpit video, audio, and even GPS coordinates are updated all simultaneously. Imagine this applied to the tracking of a migrating bird while physiological and environmental parameters are logged. Or the force of a grasshopper's leg is measured while high-speed video captures the "jump" and electrodes measure the nerves driving the legs. Instead of the GPS mapping module, you could import a 3D model of the grasshopper's leg and map the stress in the leg as a color map on the model.
DIAdem is an incredibly useful tool for managing and visualizing technical data and I'm convinced that this tool could dramatically increase the productivity of researchers in many fields.
You must be a registered user to add a comment. If you've already registered, sign in. Otherwise, register and sign in.
