- Document History
- Subscribe to RSS Feed
- Mark as New
- Mark as Read
- Bookmark
- Subscribe
- Printer Friendly Page
- Report to a Moderator
- Subscribe to RSS Feed
- Mark as New
- Mark as Read
- Bookmark
- Subscribe
- Printer Friendly Page
- Report to a Moderator
Power System Flicker
Emulator and Measurement System
By
Bernard Hu Weng Yew, Student
Rodney Tan, Senior Lecturer
UCSI University
Malaysia
Products Used
NI DAQ USB-6008
National Instrument LabVIEW 8.5
The Challenge:
Green energy has always been related with renewable energy and will soon become a replacement for fossil fuels. However, voltage flicker is the usual anomaly that presents in renewable energy thus consumers who are using power generated from renewable energy like wind farms would experience the distractive light flicker effect and to a certain extend causing migraine.
The Solution:
The flicker instantaneous level is determined by using LabVIEW 8.5 based on the design specification standard published by the International Electrotechnical Commission (IEC 61000-4-15). NI DAQ USB-6008 is used to emulate light flicker effect on a 60W, 240V coiled filament incandescent lamp.
Abstract:
Voltage flicker is a complex phenomena power quality disturbances whereby the Power System Flicker Emulator and Measurement System not only capable of emulating it as light flicker on an incandescent lamp but also to perform flicker instantaneous level measurement like an instrument digital flickermeter which is designed to measure the obnoxious light flicker easily using LabView.
Introduction
The awareness of power quality becoming more important nowadays as we become so heavily dependent up on our power system, intolerant of any failures or inconsistencies. Voltage flicker is a fluctuation in the system voltage that can result in observable changes in light output. This would cause discomfort when human are expose to it and also disruption to sensitive electronic equipment. There are two types of voltage flicker – cyclic and noncyclic, where the cyclic flicker is a repetitive form of voltage fluctuations and noncyclic flicker is an occasional voltage fluctuations. Cyclic voltage flicker often presents in areas of which energy is supplied by renewable energy like wind farm or operation of loads like electric arc furnace or spot welders.
System Overview
The Power System Flicker Emulator and Measurement complete overview block diagram is as shown in Figure 1. The system consists of a computer with preinstalled LabVIEW 8.5, NI DAQ USB-6008 and a 60W, 240V incandescent lamp. The NI DAQ USB-6008 unit is used to communicate with the incandescent lamp together with a simple circuit consisting of a triac as the triggering bridge, an opto-isolator as safety precaution, a transistor and some resistors to emulate the sensation of how voltage flicker affect an incandescent lamp.
As there are limitations in generating analogue signal to drive the voltage flicker effect on the incandescent lamp, digital output from the NI DAQ USB-6008 is adopted instead. Once the flicker emulator is switched on from the front panel, digital pulses with flicker frequency is generated and transmitted to light up the incandescent lamp. High pulses would result in lighting up the incandescent lamp and low pulses will turn it off; the frequency of switching between on and off is known as the light flicker effect.
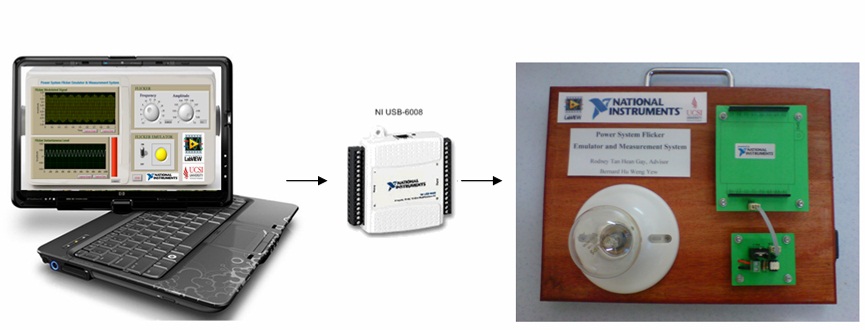
Figure 1: Block Diagram of System Overview
In order to measure power system flicker, voltage flicker is first generated by amplitude modulation between power signal (50Hz for Malaysia) and flicker. Next would be filtering the generated voltage flicker according to the IEC 61000-4-15 standard to obtain the flicker instantaneous level. Further research and development can be done from the obtained flicker instantaneous level for statistical analysis to determine the short term and long term flicker level (PST and PLT). Figure 2 depicts the picture of a power system flicker emulator operation based on the flicker frequency and amplitude.
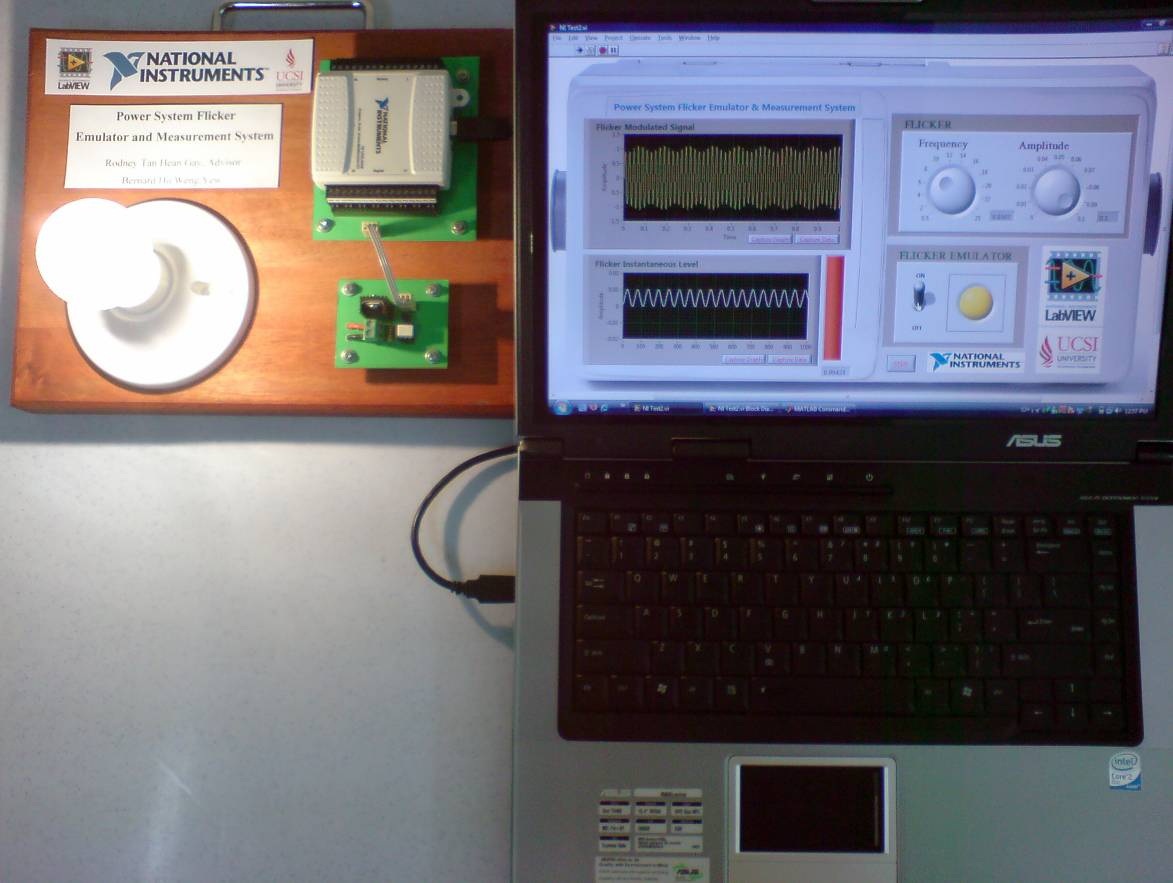
Figure 2: Power System Flicker Emulator
Results and Discussion
The graphical user interface (GUI) of the Power System Flicker Emulator and Measurement System in virtual instrument LabVIEW is shown in Figure 3 below.

Figure 3: Graphic User Interface of Power System Flicker Emulator and Measurement System
Flicker modulated signal graph portrays how modulation signal between flicker and main signal of 50Hz behave. The flicker frequency and amplitude can be determined by using the knob. Flicker instantaneous level graph shows how the lamp-eye-brain chain reacts on the flicker voltage and the bar red in color indicates the instantaneous flicker level (IFL). Flicker emulator switch is used to enable the incandescent lamp to emulate light flicker through NI DAQ USB-6008.
IEC flickermeter standard is used to obtain the flicker instantaneous level from the generated flicker modulated signal. Flicker modulated waveform can be described as flicker sine wave multiplying with power sine wave where flicker’s amplitude is 10% or less of power’s amplitude plus 1 and the spectral bandwidth ranging between 0.5 to 25Hz. This will act as a voltage adaptor block where it performs a normalization scaling of the generated flicker modulation signal to allow measurement of the signal to proceed. The following is the simplified IEC Flickermeter standard block diagram.
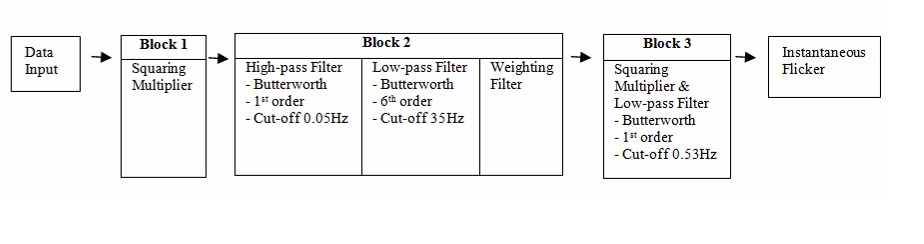
Figure 3: Simplify IEC Flickermeter Standard Block Diagram
Block 1 is the lamp model which consists of a squaring demodulator where it squares the input flicker modulated signal to simulate the behavior of the incandescent lamp. Block 2 is the eye model where it first passes through a 1st order Butterworth high-pass filter with 0.05Hz cut-off frequency followed by a 6th order Butterworth low-pass filter with 35Hz cut-off frequency to filter out unwanted frequencies produced by the demodulator in the earlier block. Next would be a weighting filter where it filters according to the transfer function below which represents the simulation of lamp-eye response.

Figure 4: Weighting Filter Transfer Function
where k = 1.74802, λ = 2 π 4.05981, ω1 = 2 π 9.15494, ω2 = 2 π 2.27979, ω3 = 2 π 1.22535, ω4 = 2 π 21.9
Since the weighting filter involves transfer functions, LabVIEW virtual instrument allows communication between Matlab and LabVIEW. In precise, the writing and execution process are made easier as Mathscript is supported in LabVIEW for real-time data acquisition.
Block 3 is the brain model where squaring is to simulate the non-linear eye-brain response followed by a 1st order Butterworth low-pass filter with 0.53 cut-off frequency. The cut-off frequency obtained from time constant of 300ms to simulate the signal transfer delay due to human brain. The output of Block 3 would be the instantaneous flicker sensation.
As observed, the instantaneous flicker level will be at its highest peak when the flicker amplitude is set to 0.1 whilst the flicker frequency is set to 8.8Hz. Flicker frequency of 8.8Hz is the critical frequency that human beings and animals are most sensitive to, as noted from the findings of various researches and observations.
Further research can be made based on the results obtained from the instantaneous flicker level using statistical analysis. Observation period of 10 minutes for short term flicker level is performed where the period is based upon assessing disturbances of a short duty cycle and 2 hours duration for long term flicker level when the duty cycle is long, such as wind turbine and arc furnaces resulting in finding the flicker severity level
Conclusion
The novelty of Power System Flicker Emulator and Measurement System is the design of an instrument digital flickermeter that is able to simulate the lamp-eye-brain effect. It obtains the flicker instantaneous level whilst emulating light flicker on a 60W, 240V incandescent lamp simultaneously. Undoubtedly, this system proves to be of very high research value and a serves as a platform for engineers to perform power quality studies on improving the existing system. The efficiency of the project has been improved considerably through the utilization of the LabVIEW virtual instrument which ultimately would make the solving of complex and challenging part of the entire project.
For more information, contact:
Rodney Tan
Senior Lecturer
University College Sedaya International (UCSI), Malaysia
No:1, Jalan Menara Gading, UCSI Heights, 56000 Kuala Lumpur Malaysia
Tel: +6017-3078955
Fax: +603-91023606
Email: rodneyt@ucsi.edu.my
