From 04:00 PM CDT – 08:00 PM CDT (09:00 PM UTC – 01:00 AM UTC) Tuesday, April 16, ni.com will undergo system upgrades that may result in temporary service interruption.
We appreciate your patience as we improve our online experience.
Course Linkage: Linear Circuit Analysis >> Voltage-Current Characteristic >> Resistors
Measurement Techniques: ELVISmx DMM (ohmmeter), custom LabVIEW VI
<hr width=”75%”>
Introduction
Overview: A voltage-current (V-I) characteristic visualizes the behavior of a two-terminal device: the device current is plotted as a function of the device voltage. The V-I characteristic plot provides valuable insight into the operation of a wide variety of electronic devices.
Objectives: In this mini-lab you will:
Learn how to use a V-I curve tracer LabVIEW application
Measure the terminal behavior of several resistors
Measure the terminal behavior of extreme cases (open circuit, short circuit)
Equipment
NI myDAQ
Breadboard
Connecting wire
Alligator clip test leads
Texas Instruments (TI) TL072 op amp or similar device
Resistors, ¼-W 5% carbon film: 3.3K, 150ohm, and 10ohm
10K potentiometer
NOTE: Any dual-supply op amp is suitable for this project. Be sure to use the correct pin numbers, though, because these vary from one device to the next. Refer to the data sheet for your device (search www.datasheetcatalog.com) or ask your instructor for assistance.
Deliverables
Submit your work in the form of a homework set problem or lab notebook entry according to the requirements of your instructor
Submit your work for each underlined boldface item, and clearly label the item with its section letter and task number
A. Experience device terminal behavior by measurement
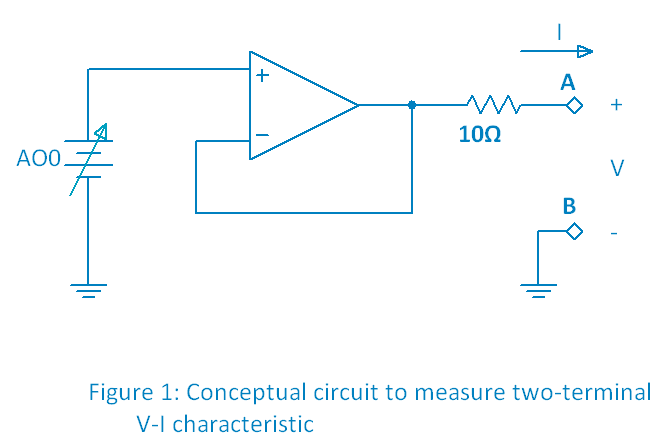
Draw the circuit shown in Figure 1, the measurement setup for the V-I curve tracer. The 10-ohm resistor is called the "shunt resistor" in this application. The shunt resistor shares the same current as the two-terminal device connected between terminals A-B, therefore the shunt resistor voltage divided by its measured value provides a convenient way to measure the device current I with the myDAQ analog input. The op amp increases the current drive capability of the applied voltage from Analog Output 0 (AO0); see the myDAQ tutorial Increase analog output (AO) current drive for more information:
Before you construct the circuit, set up the ELVISmx DMM as an ohmmeter and measure and record the resistance of each resistor.
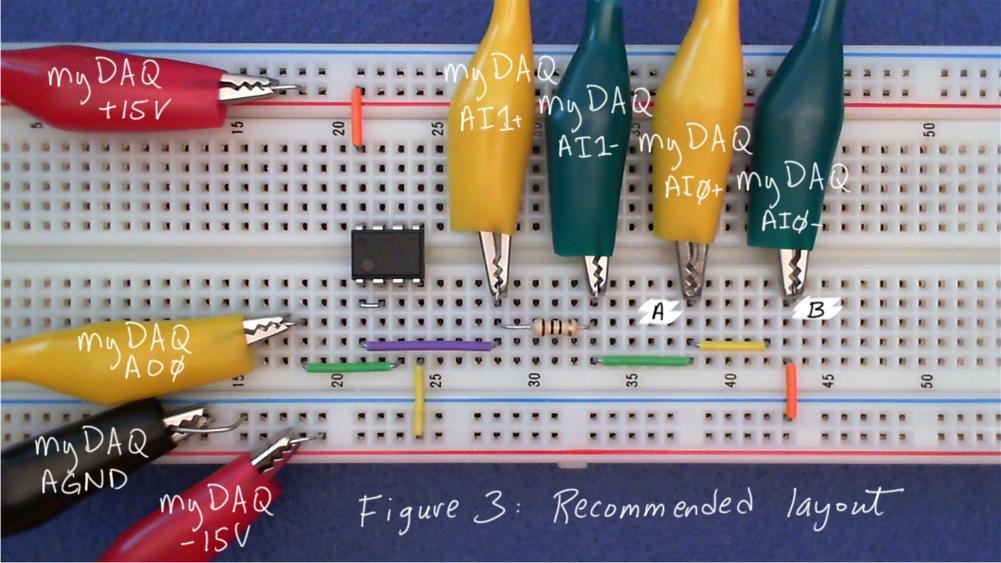
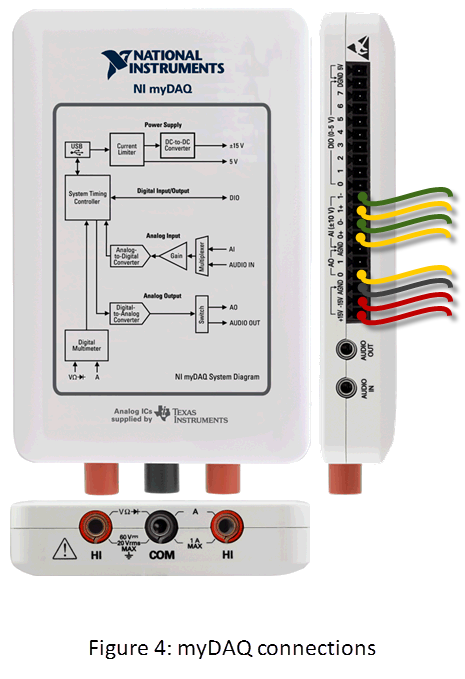
Construct the circuit of Figure 2 with myDAQ and a breadboard; see Figure 3 for the recommended layout and Figure 4 for the myDAQ connections:
Download and run the “V-I Curve Tracer” LabVIEW application linked at the bottom of this page.
Watch the video clip at the end of this section for a quick introduction to the “V-I Curve Tracer” application:
Enter your measured value for the shunt resistor.
Begin with an open-circuit connection (infinite resistance) between terminals A-B. Plot the V-I characteristic and create a screenshot of the display.
Connect a short-circuit (a wire with nearly zero resistance) between terminals A-B. Plot the V-I characteristic and create a screenshot of the display.
Explain how the two plots you just created are similar and how they are different.
Connect the 3.3K resistor between terminals A-B. Plot the V-I characteristic and create a screenshot of the display.
Connect the 150-ohm resistor between terminals A-B. Plot the V-I characteristic and create a screenshot of the display.
Summarize your results so far: What do all of the V-I characteristic plots have in common? How does the plot change as a function of resistance?
B. Learn the underlying principles
The following video tutorial introduces the V-I characteristic plot as a means to visualize the behavior of two-terminal devices such as resistors. Other meaningful interpretations of the V-I characteristic such as resistance and power are presented, too:
C. Connect the principles to your measurements:
Connect an open-circuit between terminals A-B. Vary the AO0 voltage across the full range from -10 V to +10 V and observe the device voltage (green) and current (orange) indicators. Complete this sentence by choosing the correct circuit variables: “An open-circuit connection can support any possible [ voltage | current ] but constrains its [ voltage | current ] to zero.”
Connect a short-circuit between terminals A-B. Again, vary the AO0 voltage across its full range and observe the device voltage and current indicators. Complete this sentence by choosing the correct circuit variables: “An short-circuit connection can support any possible [ voltage | current ] but constrains its [ voltage | current ] to zero.”
Sketch a V-I characteristic to scale for a 500-ohm resistor; use a voltage range of -10 to +10 voltage and a current range of -50 to +50 mA.
Connect the 10K potentiometer between the terminals A-B.
Set the plot window horizontal “V [volts]” limits to -10 V and +10 V; set the plot window vertical “I [amps]” limits to -0.05 and +0.05.
Adjust the AO0 voltage until the actual device voltage is as close to 5.00 V as you can get. Record your values of “AO0 voltage” and “AI0 device voltage”.
Enable “continuous sampling” mode and disable “persistence.”
Adjust the potentiometer until the “AI1 device current” indicator reads as close to 10.0 mA as possible. Record the measured device power and indicated “V / I” ratio.
Disable “continuous sampling” mode.
Plot the V-I characteristic over the -10 to +10 V range and create a screenshot of the display.
Compare your measured V-I characteristic to the sketch you created in Step 3.
Remove the potentiometer; measure and record its value using the ELVISmx DMM ohmmeter.
Compare your two measurements of resistance from Steps 8 and 12 to the expected value from Step 3; use percentage difference calculations.
Build your intuition:
Reflect on the following points:
Choose the correct response: The slope of the V-I characteristic curve indicates [ resistance | conductance ].
Choose the correct response: The reciprocal of the slope of the V-I characteristic curve indicates [ resistance | conductance ].
On what areas of the V-I characteristic plot does a device consume substantial power?
On what areas of the V-I characteristic plot does a device consume zero power?