Scan_Timing_Details - Usefulness of Annotations
- Subscribe to RSS Feed
- Mark as New
- Mark as Read
- Bookmark
- Subscribe
- Printer Friendly Page
- Report to a Moderator
Code and Documents
Attachment
Summary:
This example demonstrates the usefulness of Annotations and Clusters.
The User Interface requirement is to effectively capture and display multi-dimensional information.
Annotations are used on a 2-D XY graph to display multi-dimensional information. The use of annotations make the display easy to understand.
An array of clusters is used to collect a varying set of information from the user.
Function:
The VI is used to collect a time profile of currents and other settings through which a TEC is cycled.
Each time interval has multiple variables. The challenge is to easily capture and display the variables.
Steps to execute code:
- Run the VI.
- For the description of individual controls, turn on context help.
- Make settings for multiple time intervals. The XY graph display is updated with a time profile. Annotations are used to display the interval settings.
- Double click on the XY graph to stop the program.
Screenshots:

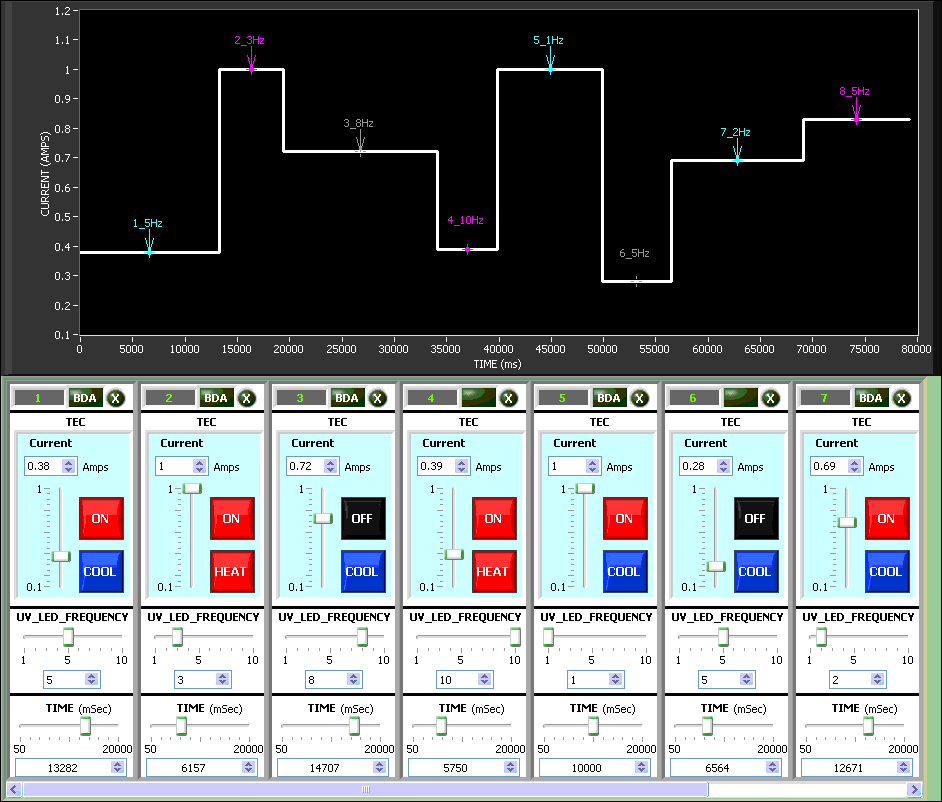
ANNOTATION
Text Format
Interval_Frequency
Legend
RED - TEC is ON and set to HEAT
BLUE - TEC is ON and set to COOL
GREY - TEC is OFF
ARROW - Indicates BDA is enabled.

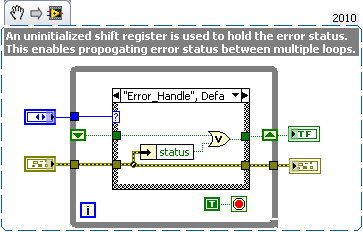
VI Snippet:
Scan_Timing_Details.vi - For some reason, the main VI snippet includes bad wires.

Create_XY_Graph_Plot.vi

Stop_Loops_On_Error.vi
VI attached below
LabVIEW 2010
Example code from the Example Code Exchange in the NI Community is licensed with the MIT license.
