- Document History
- Subscribe to RSS Feed
- Mark as New
- Mark as Read
- Bookmark
- Subscribe
- Printer Friendly Page
- Report to a Moderator
- Subscribe to RSS Feed
- Mark as New
- Mark as Read
- Bookmark
- Subscribe
- Printer Friendly Page
- Report to a Moderator
How to perform operational modal analysis of a rotating machine
The modal testing experiment presented here is performed using ModalVIEW software and National Instruments DSA hardware as the modal testing and analysis tool. When the rotating machine is running, its vibration harmonics can be regarded as sweep excitation with a broad band spectrum, as the following figure shows. The measured vibration signals are the response to broad band excitation, which contains resonance information of the machine structure. During run-up or run-down testing of rotating machine, order tracking based operational modal analysis can be used to extract modal parameters from measured vibration response of the rotating machine in its operating condition.
ModalVIEW provides Gabor transform based order-tracking method and use the least squares complex frequency domain (LSCF) method for rotating machine operational modal analysis.
Experiment scenario
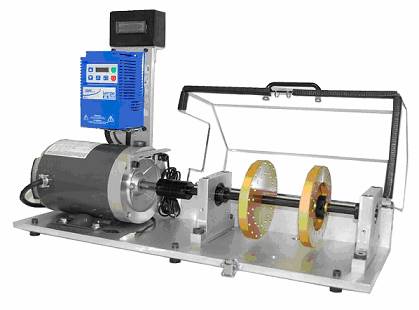
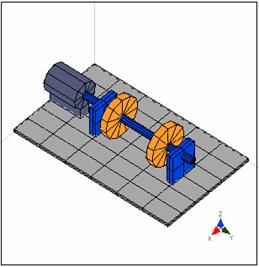
The testing object is a machinery fault simulator, as the following figure shows.
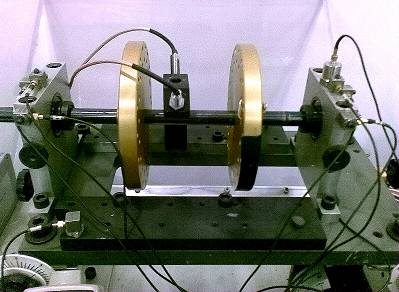
The structure vibration responses are measured from a group of accelerometers fixed on bearing support and machine base, respectively. Three accelerometers are fixed in horizontal, vertical and axial directions to measure vibration responses of the bearing support. A laser tachometer is used to obtain rotational speed of the machine, as the following figure shows. The signals from accelerometers and tachometer are acquired simultaneously using National Instruments PXI 1042Q chassis and two 24-bit PXI module NI -4472.
System configuration
In this modal testing experiment, the following software and hardware are used:
1.ModalVIEW Software.
2.NI DSA System (High-performance chassis PXI-1405, 8 channel DSA module NI PXI-4472)
3.Hammer (Lance LC1302) and Charge amplifier (Lance LC0106).
4.Accelerometer (Lance 501).
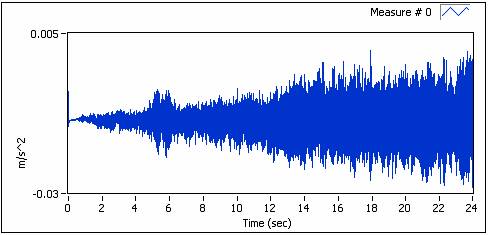
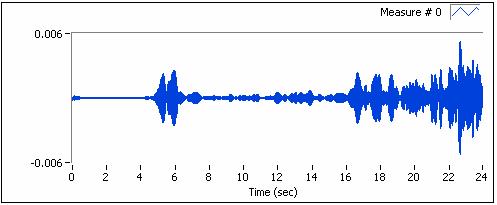
The rotating speed of the machine is changed from low to high in linearity. At the same time, vibration signals and tacho signal are measured simultaneously with sampling rate being 1kHz. The duration is 24 second, as the following figure shows.
Analysis results
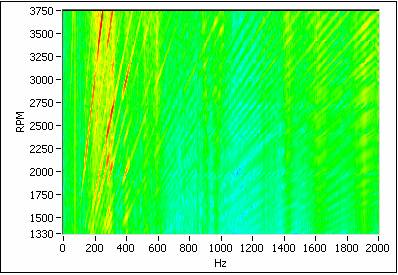
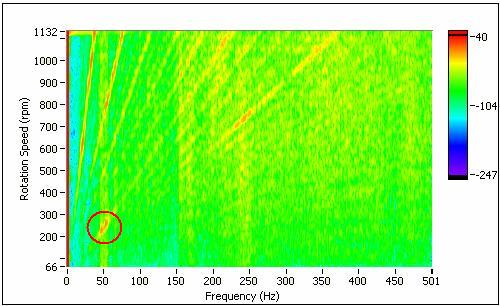
The order spectral map of vibration responses from rotating machine is shown as the following figure. The position marked by red circle on the spectral map indicates the zone related to structure resonance.
The specific vibration response to a single order is tracked from the overall vibration signal, as the following figure shows.
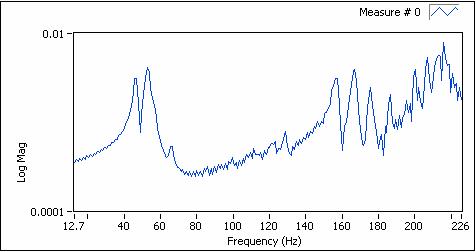
The order-tracked vibration signal is further converted into ODS FRF (modified cross-power spectrum) for modal parameter extraction, as the following figure shows.
Gabor transform based order-tracking method and use the least squares complex frequency domain (LSCF) to process generated ODS FRF. Modal analysis for the structure is finished with ModalVIEW’s advanced mode estimation method based on mode stabilization diagram. The following figure shows the clear mode stabilization diagram from 8 measured FRF data.
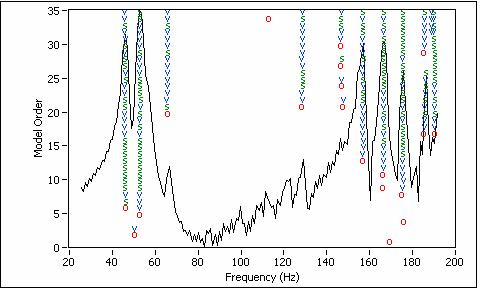
Part of the picked meaningful modes are listed in following table:
|
Index
|
Frequency (Hz)
|
Damping (%) |
|
1
|
46.3459 |
1.54028 |
|
2
|
53.1975 |
1.76153 |
|
3
|
65.9842 |
0.969631 |
|
4
|
157.28 |
0.412013 |
|
5
|
166.782 |
0.452668 |
|
6
|
175.863 |
0.519221 |
|
7
|
186.585 |
0.121619 |
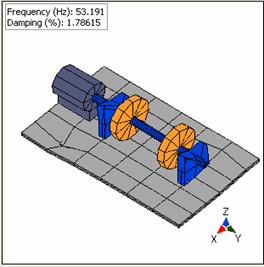
One of the mode shapes is displayed as following :
- Mark as Read
- Mark as New
- Bookmark
- Permalink
- Report to a Moderator
What was the software used to plot the mode shape?
- Mark as Read
- Mark as New
- Bookmark
- Permalink
- Report to a Moderator
Hello. the software is ModalVIEW. You could refer to
http://sine.ni.com/nips/cds/view/p/lang/en/nid/210054 for details
On Wed, Jul 6, 2016 at 9:04 AM, gui_amuchastegui <web.community@ni.com
