From Friday, April 19th (11:00 PM CDT) through Saturday, April 20th (2:00 PM CDT), 2024, ni.com will undergo system upgrades that may result in temporary service interruption.
We appreciate your patience as we improve our online experience.
From Friday, April 19th (11:00 PM CDT) through Saturday, April 20th (2:00 PM CDT), 2024, ni.com will undergo system upgrades that may result in temporary service interruption.
We appreciate your patience as we improve our online experience.
University: University of Salerno-Electronical Engineering
Team Member(s): Alessandra Casella, Maurizio Del Pizzo, Davide Faiella , Antonella Rosalia Finamore
Faculty Advisors: Professor Antonio Pietrosanto, Dr. Alfredo Paolillo
Email Address: a.finamore@studenti.unisa.it
Title: Remote GPIB management of the generator AWG2020
Products
Vehicle Software: NI LabView 8.6
Command Module Software: Windows XP, LabView 8.6
Project Challenge
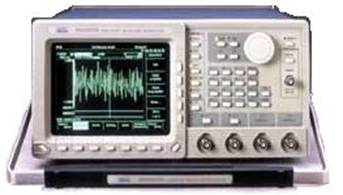
The objective of the Remote management of the generator AWG2020 project is to create an automatic measurement system able to remotely manage the generator AWG2020.
This generator, generates time-varying voltage functions written in the form of equation. It is used in many applications such as: management of faults in electrical machines (i.e. misalignment of the shaft). Is difficult to manage the generator front panel has been implemented, for this, software that emulates the operation of the instrument's front panel.
The project is divided into four main phases: creating the user interface, preview in the time domain and frequency, communication with the instrument, saving and loading of data entered by the user. One of the key parts of the project is the user interface, because it allows easy interaction with the generator.
The measuring station uses two different types of connection: cable connection GPIB to provide remote monitoring of the measuring instrument and a link between the generator AWG 2020 and LeCroy Wave Ace Oscilloscope with a BNC cable. The software developed in LabView environment, sends a string instrument, containing information regarding the type of selected functions, their characteristic parameters, the range of time and other data relevant to the proper visualization of the waveform using the GPIB cable connection between PC and AWG2020 generator.
Future developments may include: use of a large set of functions, giving users the possibility to choose also composed functions.
Project work
Measurement Station
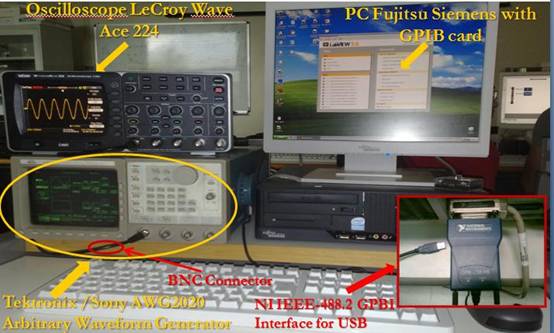
Devices that make up the measuring station are mainly two: PC with GPIB card and the polynomial generator, an AWG 2020. In addition to these, there is another measuring instrument, the LeCroy oscilloscope, in order better visualize the generated waveform.
A picture of the measuring station is show below.
Device addressing
The communication standard requires devices connected to the bus to be uniquely addressed. In this software, it was preferred to attribute network address zero, usually associated with a system controller, to the PC and address one to the generator AWG2020. The setting of the GPIB addresses on the instruments of the system has to be done manually, by working directly on the front panels of the metering devices and changing the properties of the Windows driver for the IEEE-488/USB interface. It is up to the user to comply with that because any address changes would cause the failure of communications over the bus.
Flowchart software
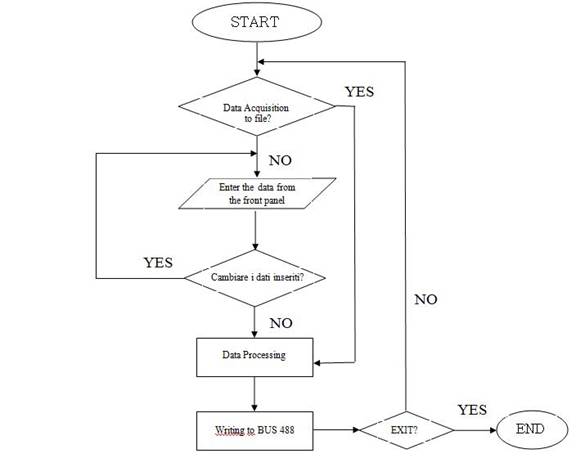
The flow chart of the used software has few steps, and the main ones are: data entry and data processing. The exit condition may be represented by the failure to satisfy the constraints imposed by the instrument or may be dictated by the desire to stop the user running the software.
A picture of the flowchart is shown below.
User Interface
The interface was designed to simulate the operation of the front panel of the generator AWG2020. It consists of:
ü a menu of seven functions (with parameters)
ü graphic preview for the time domain and frequency
ü buttons for the management of the GPIB bus, and for saving and loading the function to/from files
ü controls to enter the number of functions, number of waveform points, the offset, operator and the range.
The functions that the user can choose five are: sine, cosine, exponential, logarithm and noise.
During the execution of the software the user, acting on the interface, can change all parameters at any time.
A picture of the user interface is shown below.
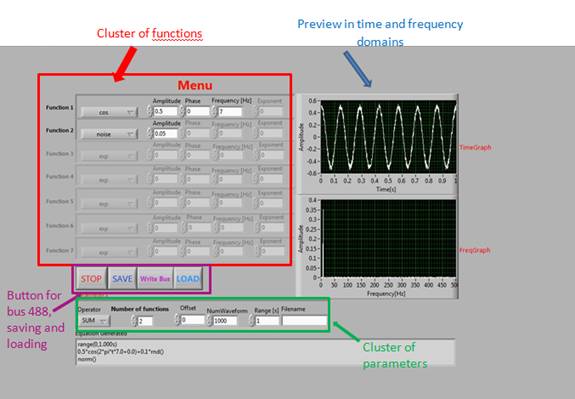
Preview in the time domain and frequency
On the user interface, described above, the display of the waveform generated by the user is continuously, both in the time domain and in frequency domain.
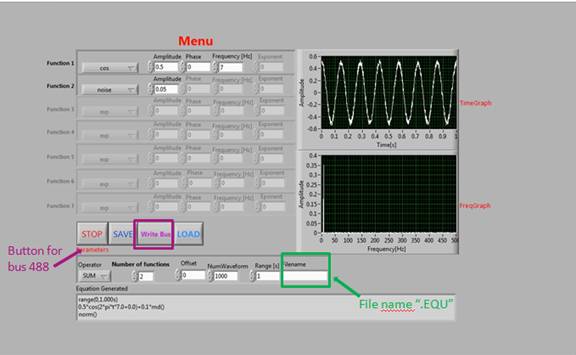
Communication over the GPIB bus
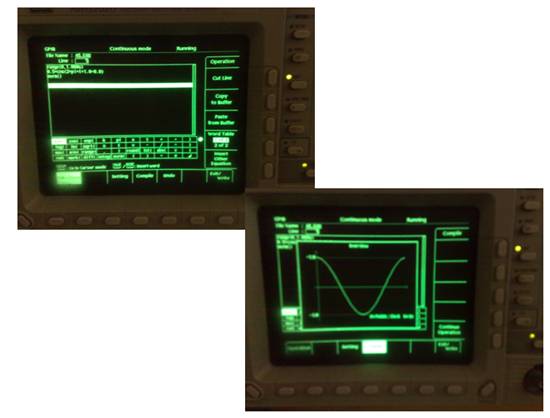
Pressing the button "WRITE BUS", the user can choose to send the signal generated by the front panel, to the generator AWG 2020. This creates, on the generator, the file ".EQU", after compilation, generates a second file ".WFM", which contains properly sampled waveform points, based on the number of waveform points, previously selected. Both files are saved in the RAM memory of the instrument. The name of the file, which will be saved, is chosen by the user through the user interface.
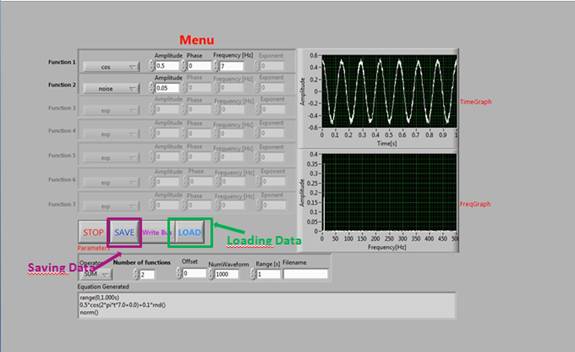
Saving and loading data
The user, by pressing the "SAVE" button, can choose to save the entered data and can reload it by pressing the “LOAD” button, which flashes out the saved data and displays the corresponding waveform.
The data will be saved in tabular format in a file. "txt ". The following one is an example:
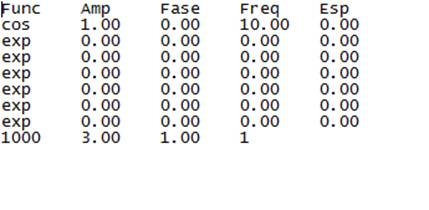
In the saved file, the last line corresponds to the number of waveform points, range, offset and type of operation.
Instrument constraints and limits
To remotely manage the generator AWG 2020, we should respect certain limits of parameter ranges, such as:
ü the number of waveform points between 64 and 32678
ü the value of offset between-2.5V and 2.5V
ü the maximum clock frequency, defined as the ratio between the number of waveform points and the time range (i.e. the duration of the single generated time window), must not exceed 250 MHz
Finally, have, to respect the Nyquist-Shannon sampling theorem, which states:
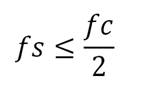
where fs is the maximum frequency that the signal can have, and fc is the sampling frequency.
Hello there,
Thank you so much for your project submission into the NI LabVIEW Student Design Competition. It's great to see your enthusiasm for NI LabVIEW! Make sure you share your project URL with your peers and faculty so you can collect votes for your project and win. Collecting the most "likes" gives you the opportunity to win cash prizes for your project submission. If you or your friends have any questions about how to go about "voting" for your project, tell them to read this brief document (https://forums.ni.com/t5/Student-Projects/How-to-Vote-for-LabVIEW-Student-Design-Projects-doc/ta-p/3...). You have until July 15, 2011 to collect votes!
I'm curious to know, what's your favorite part about using LabVIEW and how did you hear about the competition? Great work!!
Good Luck, Liz in Austin, TX.
very good
it's nice to see how old benchtop instrumentation still works. Very good.
Congratulations ! Good Job !
Back to Basics! Nice job
