- Document History
- Subscribe to RSS Feed
- Mark as New
- Mark as Read
- Bookmark
- Subscribe
- Printer Friendly Page
- Report to a Moderator
- Subscribe to RSS Feed
- Mark as New
- Mark as Read
- Bookmark
- Subscribe
- Printer Friendly Page
- Report to a Moderator
Experimental Measurement of Planetary Gear Vibration
Contact Information
University and Department: Ohio State University Mechanical and Aerospace Engineering
Team Member: Tristan Ericson
Faculty Advisor: Professor Robert Parker
Primary Email Address: ericson.15@osu.edu
Primary Telephone Number: (614) 292-9029
Project Information
Title: Experimental Measurement of Planetary Gear Vibration
Description:
Planetary gears (Figure 1) are used in many power transmission applications (Figure 2) because they are reliable and durable. Unfortunately, they generate significant noise and vibration levels. This project experimentally measures the vibration properties of a production planetary gear by modal testing and spinning tests, focusing on the independent motion of planetary components.
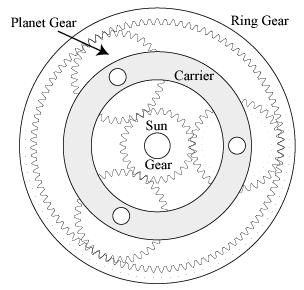 Figure 1: Planetary Gear Schematic |
Figure 2: Planetary Gear Applications (helicopters, wind turbines, automobile transmissions, farm equipment, power tools, etc.) |

Products
NI Products (hardware and software):
PXI-1042 8-Slot Chassis
PXI-8330 MIX-3 Interface Module
PXI-4472 8-Ch Dynamic Signal Acquisition Module (x3)
PXI-6602 High-Speed Counter/Timer(x2)
TB-2715 Terminal Block (x2)
LabVIEW 8.6
Sound and Vibrations Measurement Suite 5.0
Other Products:
Test article: 5-planet production planetary gear (Bell Helicopter)
Test stand (Superior Controls):
- 250 hp drive motor
- 50 gal lubrication system
- 40,000 in-lb static torque actuator
- MMI control software
Instrumentation:
- 100 mV/g accelerometer, PCB J352C66 (x21)
- 10 mV/g accelerometer, PCB 353B16 (x2)
- 36-Ch slip ring (end-of-shaft) with 1024 ppr encoder, Michigan Scientific SR36A/E1024/AX
- 10-Ch slip ring (end-of-shaft) with 512 ppr encoder, Michigan Scientific SR10A/E512/AX
- 8-Ch slip ring (over-the-shaft) with 1024 ppr encoder, Michigan Scientific B8-2/E1024
Modal tests:
- HP 33120A function generator
- MB Dynamics SS250VCF amplifier
- MB Dynamics Modal50 shaker
- 50 mV/lb force sensor, PCB 208C02
- 10 mV/lb impact hammer, PCB 086C03
Spinning tests:
- 150 hp eddy current dynamometer, General Electric 1G343
- Dyn-Loc IV dynamometer controller, Dyne Systems
Project Challenge
Planetary gears are widely used in commercial and military applications: helicopters, automobiles, wind turbines, agricultural equipment, and more. They feature a high torque-to-weight ratio, but they also generate significant noise and vibration which may lead to fatigue-induced failures in bearings or other drivetrain components. Engineers may use mathematical models [1-6] to analyze possible gear designs. These models, however, remain unsupported by controlled experiments that demonstrate the independent motion of planetary gear components.
Several experiments that do measure planetary gear vibration levels are presented in the literature [7-12]. The development of analytical and computational models, however, is outpacing this experimental research. Computer simulation tools can predict the vibration level of each planetary gear component shown in Figure 1. This is important because theoretical research suggests that the vibration properties of different planetary gear parts may be significantly different from each other. To date, no other experiments have been presented that measure the independent motion of each planetary gear component, particularly the planet gears which rotate on two axes simultaneously.
The challenge of this project is to independently measure the vibration of each planetary gear component shown in Figure 1 (sun gear, ring gear, carrier, and planet gears). Experiments with this level of detail are necessary to validate computer models and provide industry design guidance.
Solution
There are two basic testing configurations: spinning tests and modal tests. These methods are fundamentally different in the way they acquire and analyze data, although the results from both techniques reveal the same basic characteristics of planetary gear vibration. LabVIEW is used to acquire and post-processing data in both of these configurations. It is also used in a control application in modal tests.
Spinning Tests:
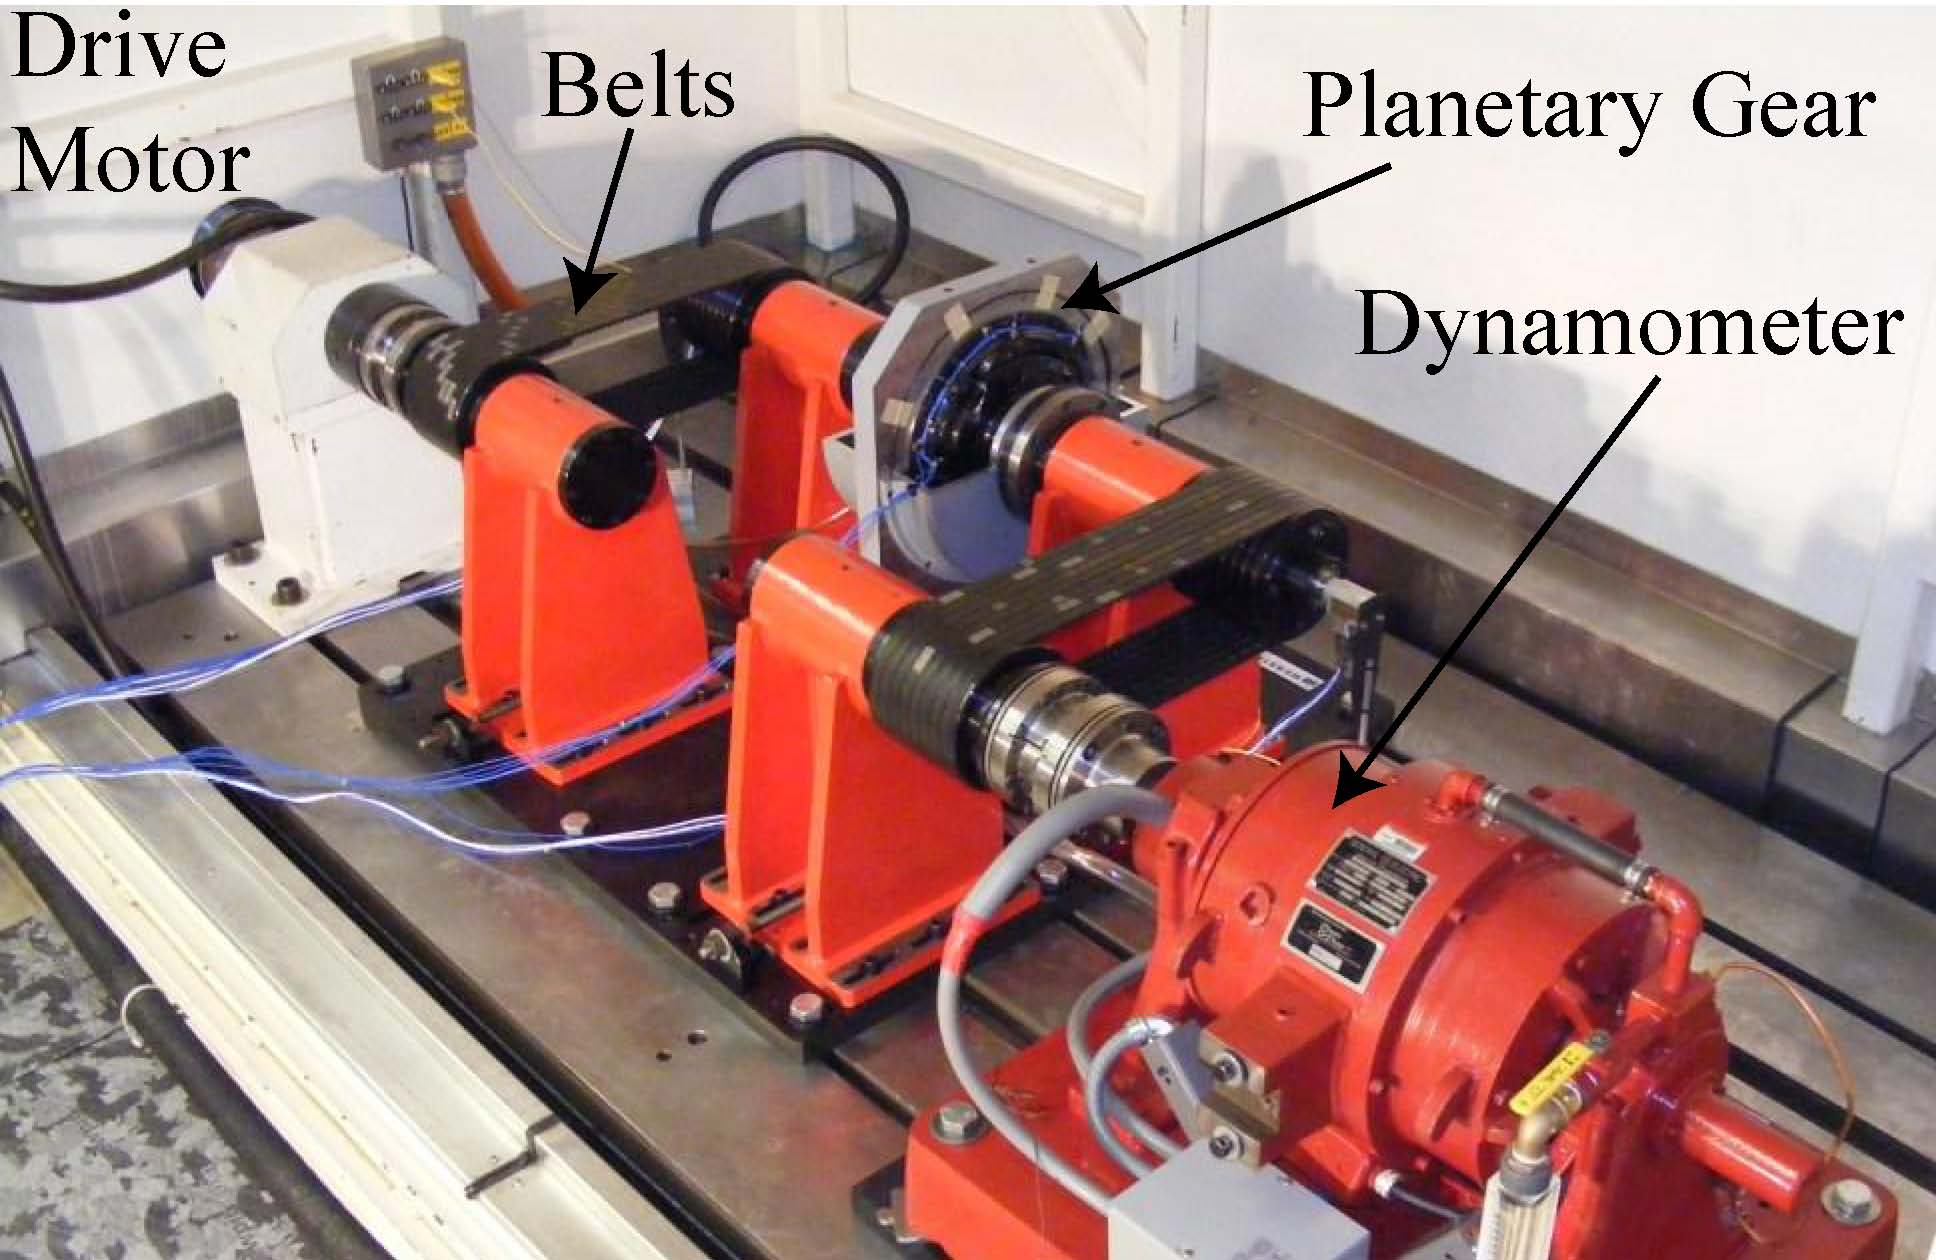
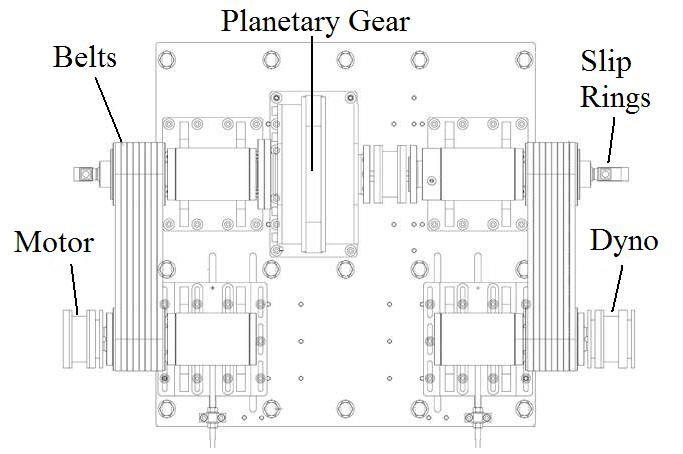
Figures 3 and 4 show the spinning test configuration. The planetary gear is driven by a 150 hp AC drive motor not shown in the photograph (off to the upper left). A 150 hp dynamometer (lower right, red) is used to apply load. The planetary gear is offset from the motor/dyno axis by belts to allow for instrumentation access (slip rings).
In these experiments the planetary gear speed is incrementally increased through its operating range. Data is acquired at each incremental speed. Twenty-one accelerometers and four encoders are simultaneously sampled. Vibration levels of each gear component are analyzed throughout the sweep to find natural frequencies and mode shapes. There are many natural frequencies excited by multiple harmonics of the meshing teeth. LabVIEW order tracking is used to separate out the vibration levels to understand the data.
Figure 3: Spinning Test Configuration |
Figure 4: Spinning Test Schematic |
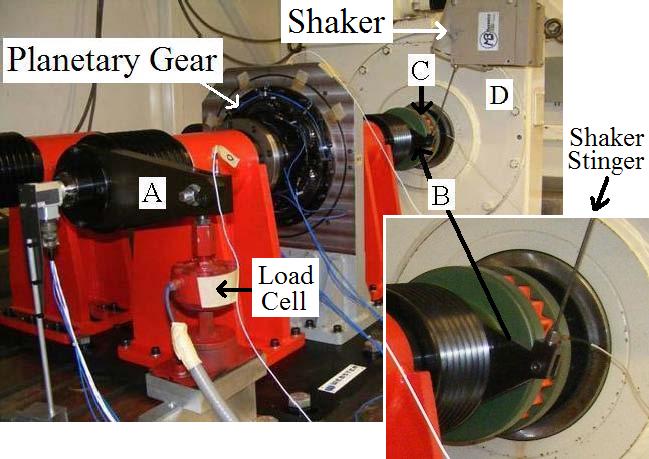
Modal Testing:
Figures 5 and 6 show the modal test configuration. The planetary gear is not rotating during these experiments. Rather, a static torque is applied while a modal hammer or vibration shaker excites the loaded system. The vibration shaker can apply several useful excitations. The following list outlines the different modal testing methods and their advantages. The first four methods use transient post-processing techniques, while the last method uses steady state techniques.
1. Impact (easy and mobile)
2. Chirp (shaker, broadband, control of excitation range)
3. Random (shaker, broadband)
4. Sweep (shaker, greater energy at each frequency)
The shaker sweep method was successfully used to match experimental predictions with an analytical model. LabVIEW control was an important aspect of these experiments. While recording data, LabVIEW monitors the actual input force measured at the shaker and uses a proportional controller to scale the applied voltage amplitude at the subsequent frequency step. This technique allows constant force excitation across a wide range of frequencies.
Figure 5: Modal Testing Configuration | 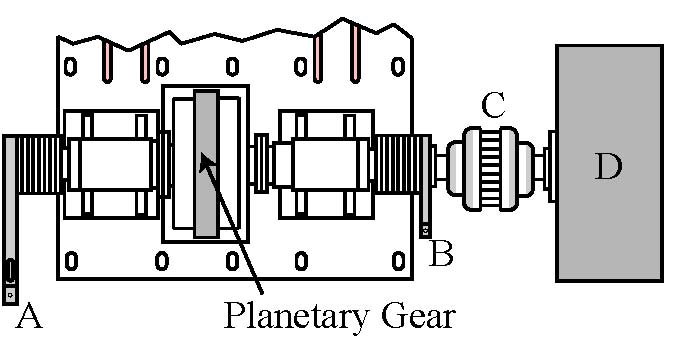 Figure 6: Modal Test Schematic A – load cell arm B – modal arm C – compliant coupling D – torque actuator |
Instrumentation:
Twenty-one accelerometers and four encoders simultaneously track the motion of all planetary gear components during spinning tests. Torque is monitored at the drive motor and dynamometer shafts. An analog tachometer signal is measured at either the input or output shaft, although the encoders accurately measure gear speed and mesh frequency.
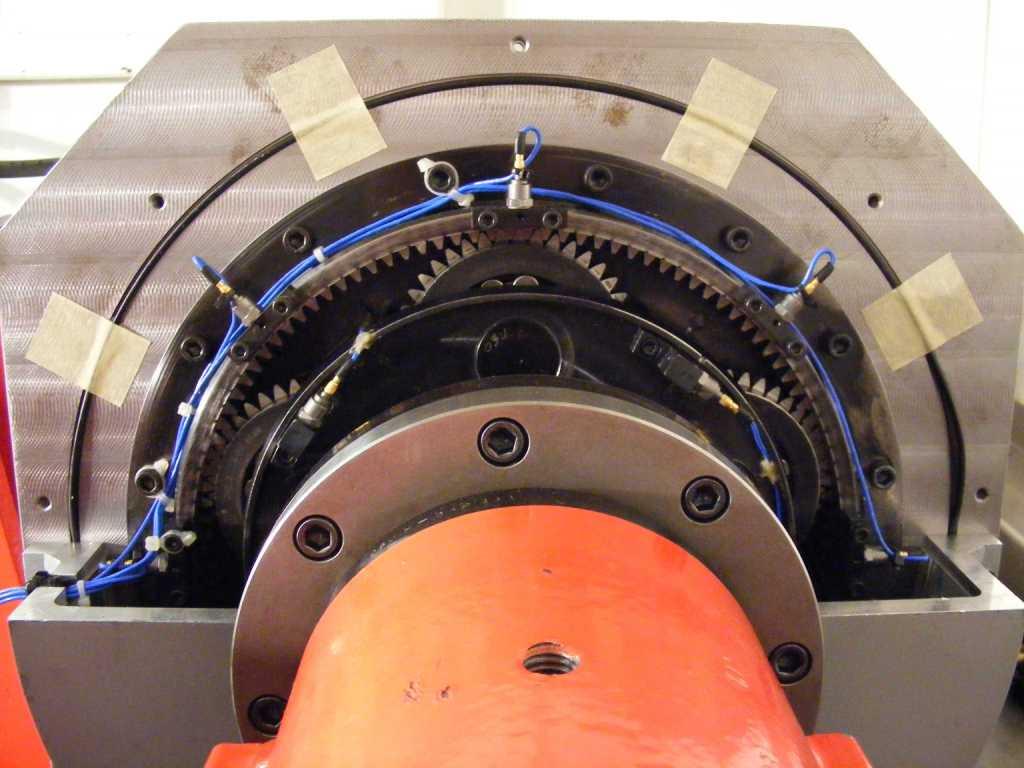
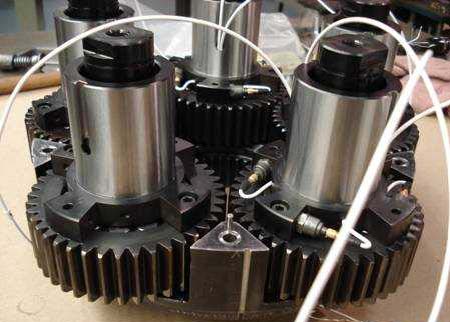
Similar instrumentation is used in both spinning tests and modal tests. Rotational and translational vibrations of rotating bodies (carrier, sun gear, and two of five planets) are measured using four tangentially-mounted accelerometers. The sensors are rigidly connected to the gear bodies near the meshing teeth to ensure measurement reliability. Figure 7 shows the tangentially-mounted carrier accelerometers and radially-mounted ring gear accelerometers. Figure 8 shows the accelerometers mounted to the planet gears.
Figure 7: Accelerometers Mounted Directly to Ring Gear and Carrier |
Figure 8: Accelerometers Mounted to Two of Five Planet Gears |
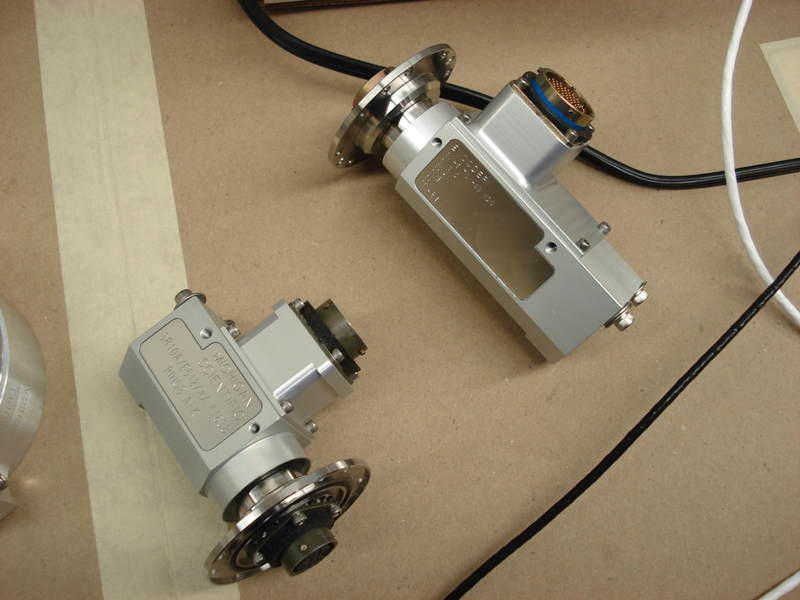
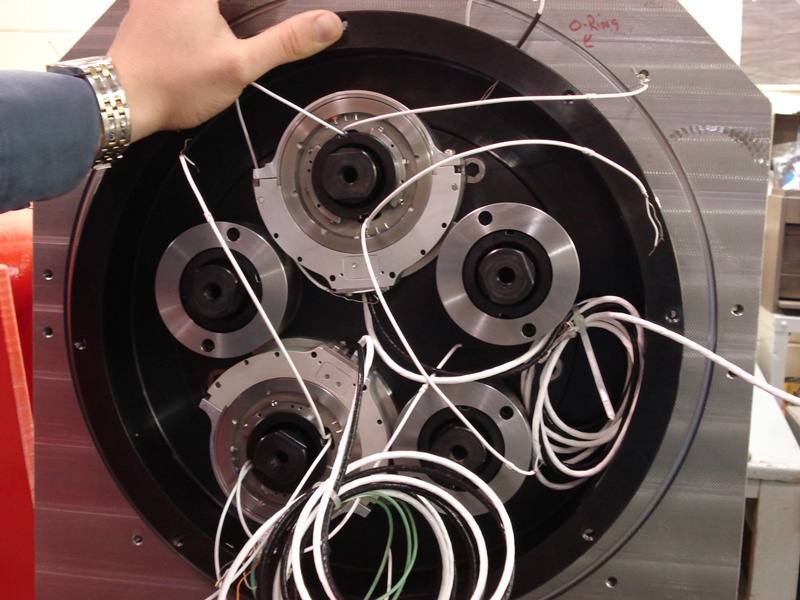
Slip rings are used to transmit data from rotating gears to the DAQ system during spinning tests. The rotating sun gear and carrier are equipped with the end-of-shaft slip rings shown in Figure 9. Signals from planet gears—which rotate on two axes simultaneously—must pass through two slip rings. Figure 10 shows the planet slip rings on the two instrumented planets that transmit data to the carrier reference frame before they pass with the carrier signals through the carrier slip ring to the DAQ system. Each slip ring is equipped with an encoder that tracks the instantaneous gear position necessary for post-processing that calculates rotational and translational vibration.
Figure 9: 10-Ch Sun Gear Slip Ring with 512 ppr Encoder and 36-Ch Carrier Slip Ring with 1024 ppr Encoder |
Figure 10: Two 8-Ch Planet Slip Rings with 1024 ppr Encoder Mounted to Planet Gear Adapters in Carrier |
Data Acquisition:
LabVIEW is used extensively for all data collection and analysis. All application modules use a common file format to store data collected from the test stand. The datalog file format is used because of its balance between ease of use and disk space efficiency. (Binary format is the most flexible and disk space efficient, but requires excess program time. Text files are very easy to use, but require extra disk space.) While the datalog file has drawbacks, its ability to store engineering units associated with each measurement and relative ease of use make it a nice choice.
Each datalog file is stored in a series of records. Each record contains a cluster of data with slight variations in (1) spinning test data, (2) impact test data, and (3) modal shaker data. In general, each file has arrays of waveforms from accelerometers on each gear; sampling information; and tachometer data for spinning tests, an impact waveform for impact testing, or the shaker force signal for shaker testing. Figure 11 shows the data cluster containing all of the saved data in spinning tests.
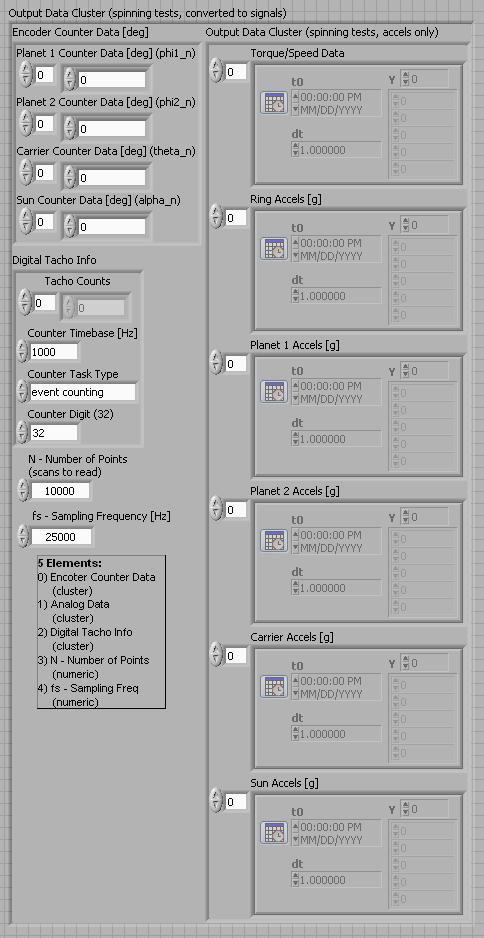
Figure 11: Output Data Cluster Control for Storing Data in Spinning Tests
More that fifty custom LabVIEW programs are used to collect and process data. The larger programs are extensive, so it is not possible to provide a complete description. A summary to highlight the use of these tools of now provided. First, code from the impact testing modules is presented. Many shaker testing modules are similar, so only a few differences are discussed. Finally, a review of the spinning test programs is presented.
Impact testing
Most of the front-end user programs use tab controls to organize data. Figure 11 shows the initial impact testing screen with all of the user controls. In this screen, the user can choose to:
1. Write the acquired data to file
2. Adjust the trigger level
3. Set the averaging parameters
4. Identify any broken accelerometers
5. Select windowing
6. Set the sampling parameters
7. Specify channel properties (excitation, sensitivity, label)
and more.
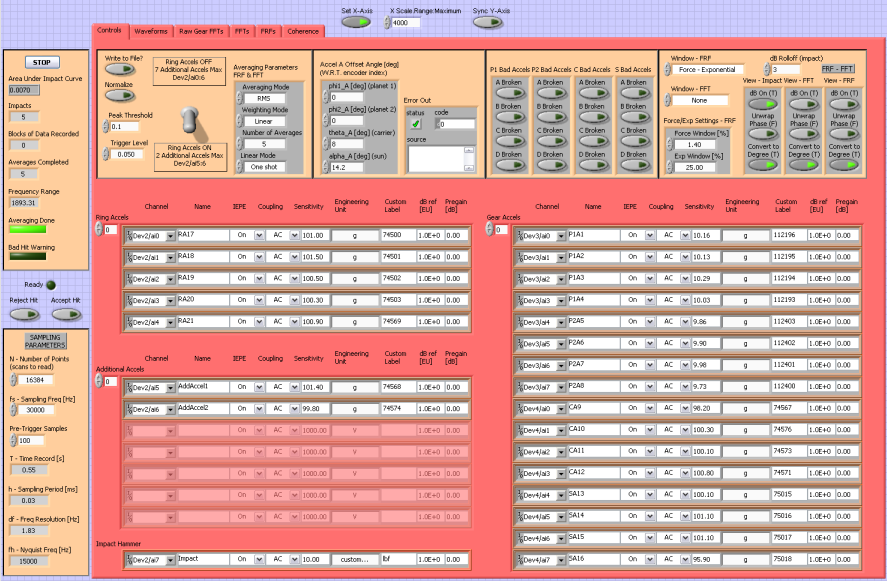
Figure 12: Impact Testing Controls
Figure 13 shows the time-domain waveforms collected during impact testing. The top two traces show the impact signal on two time scales. The remaining graphs show all of the impact signals. A Bad Hit Warning light indicates if there is a double hit detected by a custom subscript. After inspection, the user chooses to acceptor reject the hit.
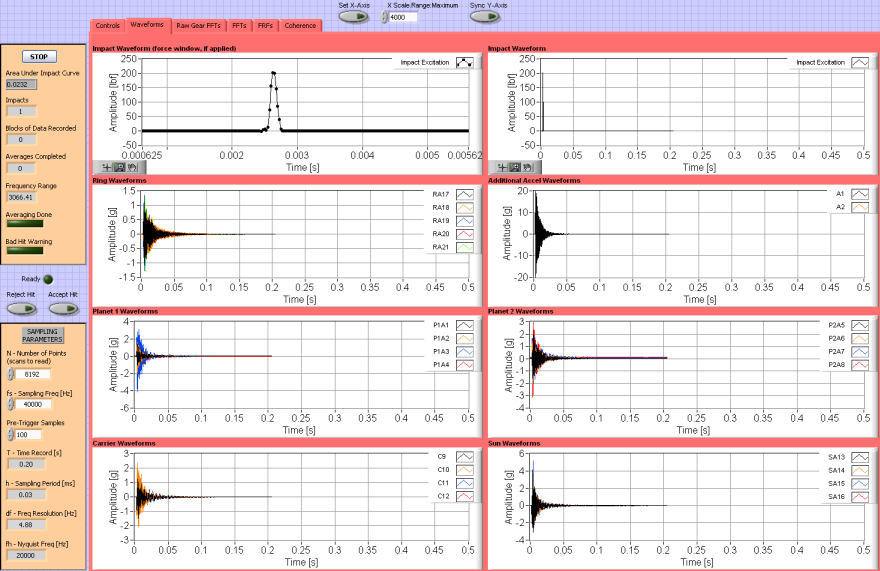
Figure 13: Time Traces of the Impact Waveform and All Accelerometers
Figure 14 shows the FFTs of all signals. System dynamics and natural frequencies are easily identified. A custom subscript calculates the rolloff frequency of the impact FFT (which can be viewed before accepting or rejecting a hit). A similar tab control showing the frequency response functions (FRFs) for all of these signals can also be viewed. The final tab shows the coherence of all signals. A video demo of an impact test is provided.
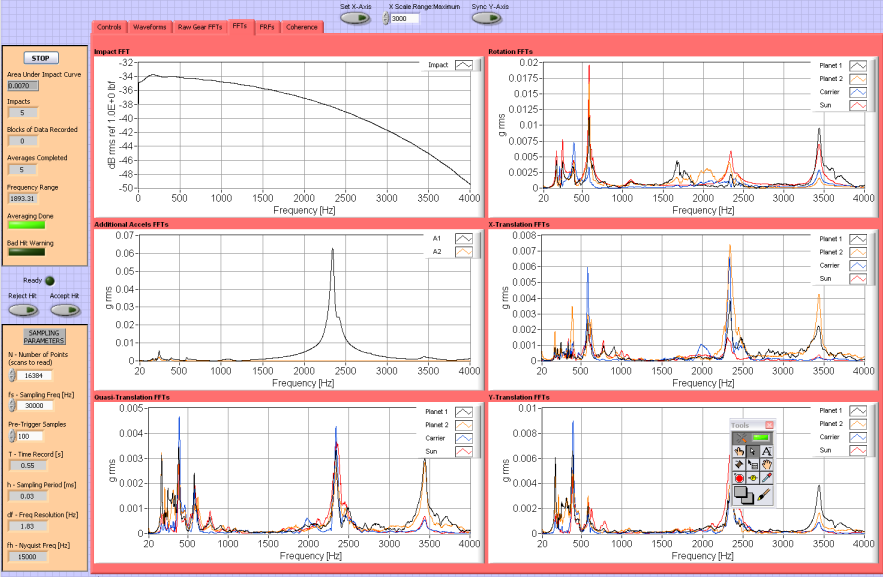
Figure 14: Calculated FFTs for Gear Rotation and Translation with the Impact Signal FFT and Two Additional Accelerometers
Shaker testing
Transient methods are used with modal shaker testing. These tests, which use random or chirp excitation, are similar to the impact tests shown above, so screen shots are not presented. A video demo showing the use of LabVIEW in a chirp shaker test is provided.
One advancement in the functionality of the shaker test code is the ability to control the shaker excitation frequency and amplitude during sweep tests. LabVIEW is able to communicate with a HP33120A function generator through a DB9 null modem cable that sends a signal to the shaker through an amplifier. LabVIEW can command the function generator to create a signal within the function generator’s functionality (e.g. a sine wave of particular frequency and amplitude) or upload an arbitrary waveform generated within LabVIEW. It is necessary to adjust the excitation amplitude as the frequency is swept through the desired range in order to hold the shaker input force constant. A custom LabVIEW subscript uses a proportional controller to adjust the excitation amplitude throughout the frequency sweep.
As with all experiments, there are programs to collect data and other programs to open and post-process saved data. Figures 15 and 16 highlight data processing programs used to analyze previously recorded shaker sweep data. Figure 15 shows the output of a file that processes all gear rotational and translational degrees-of-freedom for one file. The user is able to:
1. Select the desired file
2. Choose averaging parameters
3. Identify any broken accelerometers (to adjust the rotational and translational calculation scripts)
4. Select a desired frequency range
5. Track a particular order, if desired
6. Normalize the result to the actual input force
7. Output the results to a MATLAB file
and more.
In the output tabs, the user can view the output spectrum acceleration or displacement from each individual accelerometer or in gear degrees-of-freedom (rotation/translation).
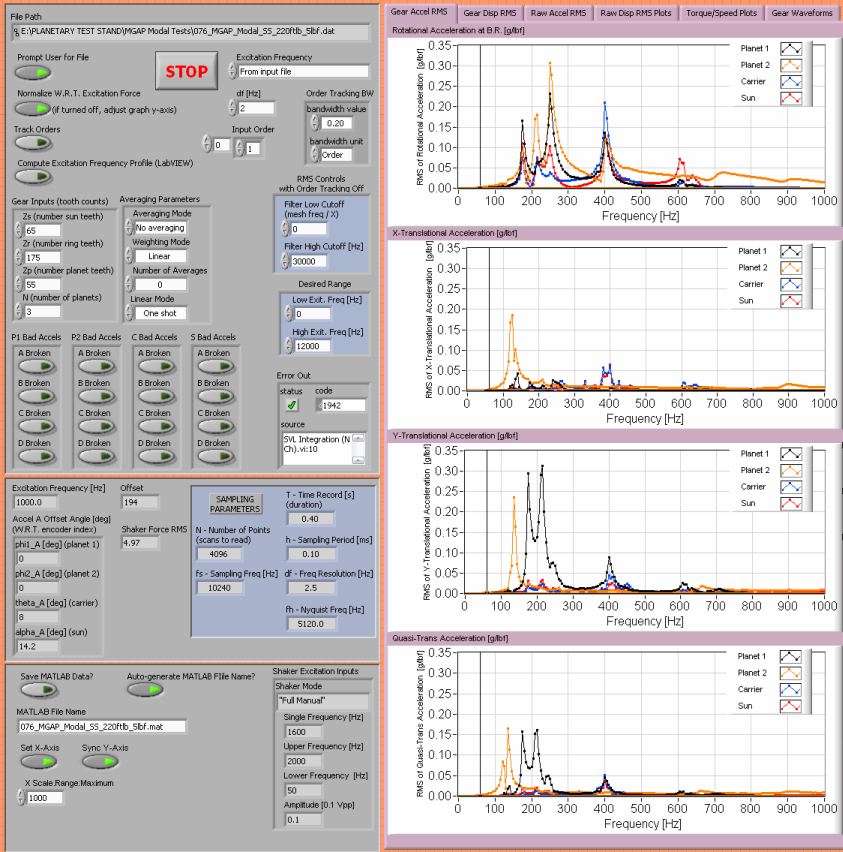
Figure 15: User Interface to Calculate Vibration RMS Response for All Degrees-of-Freedom in One File
Figure 16 shows the output of a file that processes one gear degree-of-freedom (in this case, carrier rotation) in multiple files (in this case, 3).
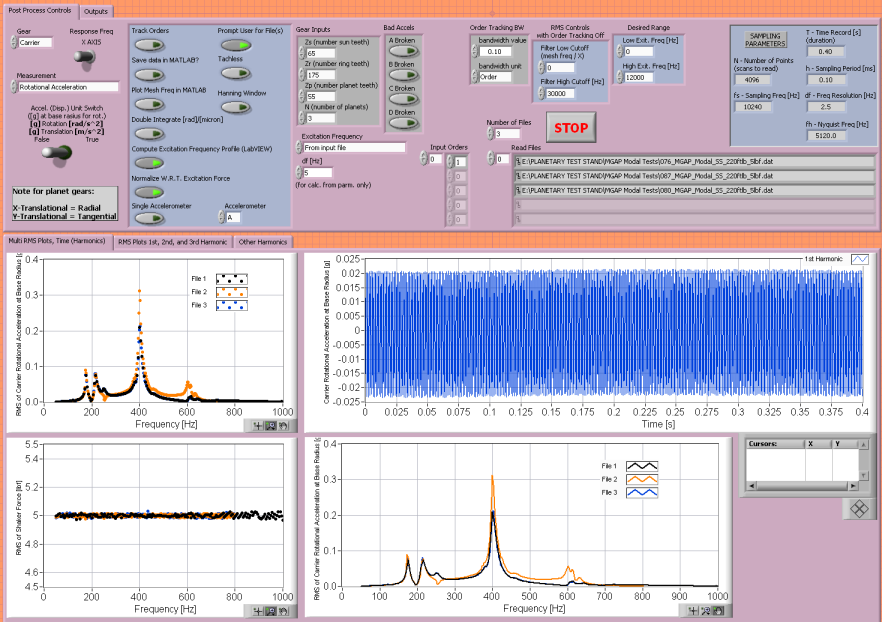
Figure 16: User Interface to Calculate Vibration RMS Response for One Degree-of-Freedom in Multiple Files
Spinning tests
Many of the modules used in spinning tests are based on the same principles discussed above in the review of modal testing programs. As the speed of the test stand is swept slowly through its operating range, or held constant at a desired value, data is recorded in the format displayed in Figure 11. None of the data collected is output to the front panel during spinning tests to increase processing time. In the post-processing modules, the following operations can be performed:
1. Replay the time history (in whole or parts)
2. Manage the data files (delete unwanted blocks, split files, merge files, etc.)
3. Cycle through data blocks and plot the frequency spectrum at each block
4. Plot the RMS of each output vs. frequency across the speed range
5. Use order tracking to plot the response to various mesh frequency harmonics for a given degree-of-freedom
6. Calculate and plot a mode shape
7. Plot a spectral map or waterfall plot
8. Export data to MATLAB .mat file format
Plotting the overall RMS of measured data at each speed does not provide much insightful data. Several mesh harmonics excite many natural frequencies, rendering individual peaks less distinguishable. The frequency spectra throughout the speed range shows low amplitude vibration away from mesh frequency harmonics, so LabVIEW order tracking is used to isolate vibrations at each harmonic (item 5 on the list above), making it easier to identify natural frequencies and understand the dynamic response.
Few programs are small enough to show a block diagram, but the program which logs spinning data is one because the data is not directly analyzed and plotted in this program. Figure 17 shows the block diagram for spinning test data collection. The AI sample clock is used as the timebase for encoder sampling to synchronize data acquisition across multiple data acquisition cards (3x 4472 cards and 2x 6602 cards).
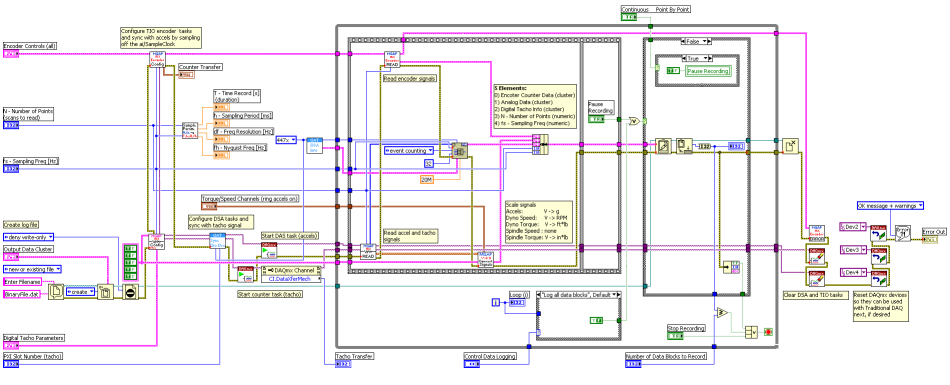
Figure 17: Block Diagram of Spinning Test Data Logging Code
Results
The results of this project are published in the proceedings papers listed below. Only a brief summary will be provided here to convey the significance of the results from this study. For a complete understanding, the papers should be consulted.
Modal testing revealed that there are two groups of natural frequencies. The first group (below 1,000 Hz) contains modes that are associated with shaft and fixture deformation. The second group (above 2,000 Hz) contains modes that are associated with deflection in the planetary gear teeth. The second group of natural frequencies is important because they will be the primary contributors to planetary gear noise and vibration in actual applications. Figure 18 below illustrates the qualitative difference between a low frequency mode with primary deflection in the shafts and a high frequency mode with primary deflection in the gear meshes and planet bearings.
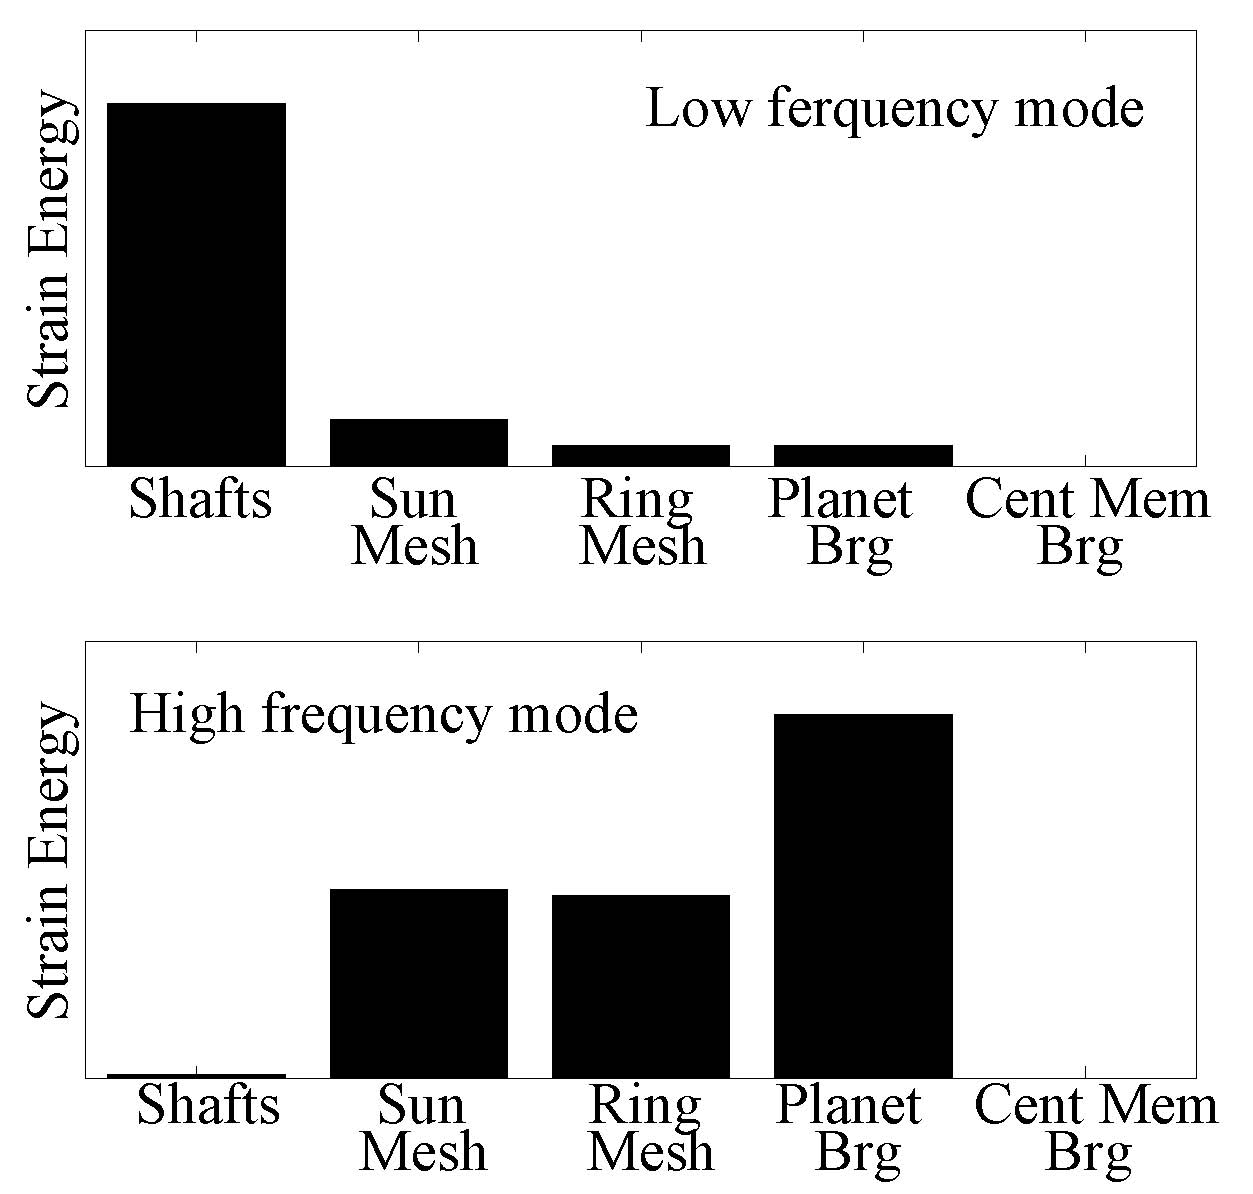
Figure 18: Strain Energy Comparison between a Low Frequency Mode and a High Frequency Mode.
The experimental results are compared with an analytical model [6]. In modal testing, twelve of the fifteen natural frequencies agree within 5% error, the other three within 15%. All of the natural frequencies predicted by the model are accounted for in experiments. In addition to the natural frequencies, FRFs, which include mode shape information, also agree well between the model and experiments. Figure 19 shows a comparison between planet rotation that is measured experimentally and predicted by the model. This data shows solid agreement between experiments and a model for such a large multi-degree-of-freedom system.
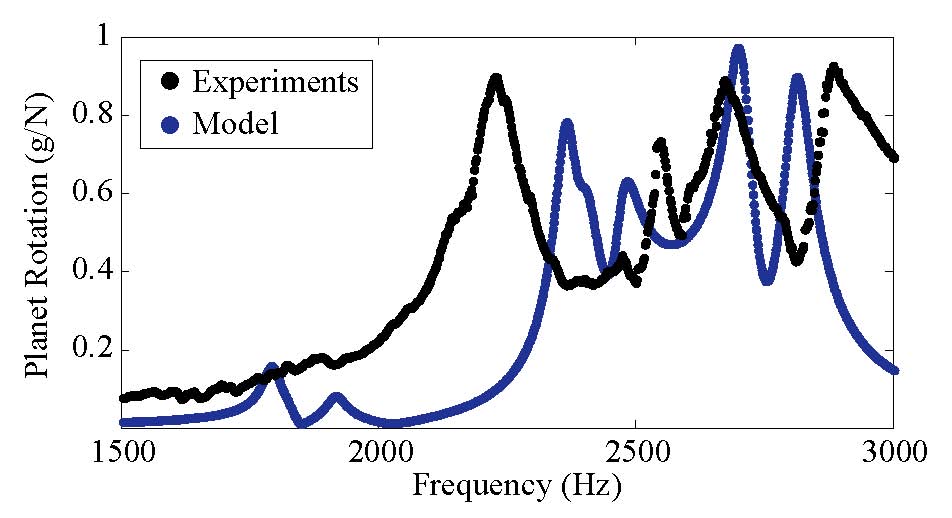
Figure 19: Planet Rotation Measured Experimentally and Predicted by and Analytical Model
Spinning tests highlight the need to measure the vibration of each gear independently. Figure 20 shows the dynamic response of the carrier and sun gear in rotation and translation. LabVIEW order tacking is used to isolate the response at the 1st and 2nd harmonic of mesh frequency. The important information contained in these graphs lies in their differences. The data in all four of these plots is collected in the same test. If one were to measure carrier rotation only (Figure 20a), natural frequencies at 270 Hz and 420 Hz would be measured. The 610 Hz natural frequency in sun gear rotation (Figure 20b), however, would be missed entirely. Similarly, the response between the rotational degrees-of-freedom (Figure 20a, b) and translational degrees-of-freedom (Figure 20c, d) is significantly different. This research shows the importance of considering the vibration of all planetary gear components, not just a small subset of the system.
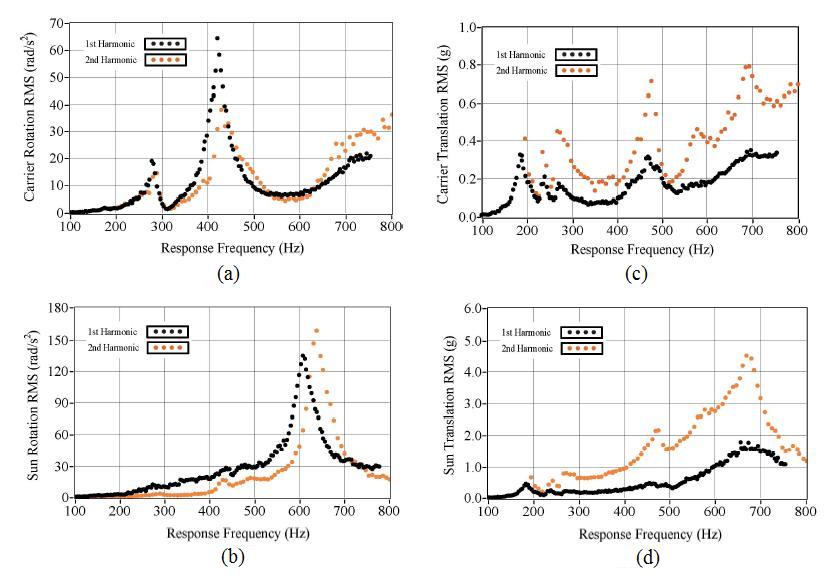
Figure 20: Planet Rotation Measured Experimentally and Predicted by and Analytical Model
As indicated in Figure 20 and the discussion above, there is a qualitative difference between rotational and translational response. In fact, analytical research shows that the modes associated with a planetary gear can be classified into three types: rotational, translational, and planet modes [6]. As the names suggest, the natural frequencies within these mode types are dominated by rotational, translational, and planet only motion respectively. This experimental research has been used to strongly support the classification of planetary mode types. Again, much more information is found in the papers published from this research, listed below. A brief summary of the primary contributions follows:
1. Different gear bodies exhibit significantly different frequency response characteristics. Measurements at one or two locations are not adequate to fully characterize the dynamics of the system.
2. Higher harmonics of mesh frequency may excite natural frequencies as much as the fundamental harmonic. These higher harmonics should be considered at typical speeds and might excite natural frequencies beyond the operating mesh frequency range.
3. The classification of rotational, translational, and planet modes established in the research literature is experimentally validated.
4. Natural frequencies and modes predicted by an analytical model are validated experimentally by modal testing and spinning tests.
5. Dynamic response, including vibration amplitude, agrees between the experiments and a model across a wide frequency range.
6. Separation of low-frequency shaft modes below 1,000 Hz and high-frequency tooth deflection modes is demonstrated in the experiments and the model.
Benefits of Using LabVIEW:
As described throughout this report, LabVIEW was an integral part of this research. It was used at every stage, including data collection, experiment control, and post-processing. Some of the significant features of LabVIEW that contributed to the success of this project are:
1. Versatility to create data collection, control algorithm, and data analysis code within one framework
2. Ability to analyze signals from a variety of sensors (analog input, pulse train, IEPE, etc.)
3. Synchronization of multiple channels on multiple devices (including different types of devices)
4. Easy expansion and adaptation of existing programs, and convenient debugging tools to troubleshoot problems
5. Ability to communicate with and export data to MATLAB
6. Communication with function generator through DB9 null modem cable while performing data collection
7. Data collection triggering
8. Factory modules equip to manage signals from encoders set up in quadrature configuration
9. Functionality of sound and vibrations analysis modules to generate FFTs, FRFs, spectral maps, waterfall plots, RMS calculations, etc.
10. Order tracking analysis
Papers:
[1] T. M. Ericson and R. G. Parker, “Design and Conduct of Precision Planetary Gear Vibration Experiments”, SAE2009 Noise and Vibration Conference and Exhibition, paper 2009-01-2071, St.Charles, IL, May 2009.
[2] T. M. Ericson and R. G. Parker, “Vibration Measurements of an OH-58D Helicopter Planetary Gear under Operating Conditions”, American Helicopter Society Forum 66, Phoenix, May 2010.
[3] T. M. Ericson, “Vibration of a Helicopter Planetary Gear: Experiments and Analytical Simulation”, 25th HayesGraduate Research Forum, http://hdl.handle.net/1811/48342, Columbus, March 2010.
[4] T. M. Ericson and R. G. Parker, “Planetary Gear Modal Properties and Dynamic Response: Experiments and Analytical Simulation”, 11th ASME Power Transmission and Gearing Conference, Washington D.C.,August 2011, paper DETC2011-47142.
Project Videos
Project Overview Video
Impact Test Demo Video
Shaker Test Demo Video
References
[1] Cunliffe, F., Smith, J. D., and Welbourn, D. B., 1974. “Dynamic tooth loads in epicyclic gears”. ASME Journal of Engineering for Industry, 95(2), May, pp. 578–584.
[2] Botman, M.,1976. “Epicyclic gear vibrations”. Journal of Engineering for Industry, 98(3),Aug., pp. 811–815.
[3] August, R., and Kasuba, R., 1986. “Torsional vibrations and dynamic loads in a basic planetary gear system”. Journal of Vibration, Acoustics, Stress, and Reliability in Design, 108(3), July, pp. 348–353.
[4] Saada, A., and Velex, P., 1995. “An extended model for the analysis of the dynamic behavior of planetary trains”. Journal of Mechanical Design, 117(2), June, pp.241–247.
[5] Kahraman, A., 1994. “Natural modes of planetary gear trains (letters to the editor)”. Journal of Sound and Vibration, 173(1), pp. 125–130.
[6] Lin, J., and Parker, R. G., 1999. “Analytical characterization of the unique properties of planetary gear free vibration”. Journal of Vibration and Acoustics, 121(3),July, pp. 316–321.
[7] Schlegel, R.G., and Mard, K. C., 1967. “Transmission noise control approaches in helicopter design”. In ASME Design Engineering Conference, no. 67-DE-58.
[8] Toda, A., and Botman, M., 1980. “Planet indexing in planetary gears for minimum vibration”. ASME(79-DET-73).
[9] Platt, R.L., and Leopold, R. D., 1996. “A study on helical gear planetary phasing effects on transmission noise”. In VDI Berichte, no. 1230, pp. 793–807.
[10] Hidaka, T.,Terauchi, Y., and Nagamura, K., 1976. “Dynamic behavior of planetary gear (1st report, load distribution in planetary gear)”. Bulletin of JSME, 19(132), June,pp. 690–698.
[18] Hidaka, T.,Terauchi, Y., and Ishioka, K., 1976. “Dynamic behavior of planetary gear (2nd report, displacement of sun gear and ring gear)”. Bulletin of the JSME,19(138), Dec., pp. 1563–1570.
[11] Hidaka, T.,Terauchi, Y., and Ishioka, K., 1979. “Dynamic behavior of planetary gear (4th report, influence of the transmitted tooth load on the dynamic increment load)”. Bulletin of the JSME, 22(167), June, pp. 877–884.
[12] Hidaka, T.,Terauchi, Y., and Nagamura, K., 1979. “Dynamic behavior of planetary gear (6th report, influence of meshing-phase)”. Bulletin of the JSME, 22(169), July, pp.1026–1033.
Ohio State University Mechanical Engineering
Dynamics and Vibrations
201 West 19th Ave Suite N350
Columbus, OH 43210-1142
Office: 614-292-9029
Lab: 614-247-8077
Fax: 614-292-3163
"No one is useless in this world who lightens the burden of another." - Charles Dickens
- Mark as Read
- Mark as New
- Bookmark
- Permalink
- Report to a Moderator
Hello there,
Thank you so much for your project submission into the NI LabVIEW Student Design Competition. It's great to see your enthusiasm for NI LabVIEW! Make sure you share your project URL with your peers and faculty so you can collect votes for your project and win. Collecting the most "likes" gives you the opportunity to win cash prizes for your project submission. If you or your friends have any questions about how to go about "voting" for your project, tell them to read this brief document (https://forums.ni.com/t5/Student-Projects/How-to-Vote-for-LabVIEW-Student-Design-Projects-doc/ta-p/3...). You have until July 15, 2011 to collect votes!
I'm curious to know, what's your favorite part about using LabVIEW and how did you hear about the competition? Great work!!
Good Luck, Liz in Austin, TX.
