- Document History
- Subscribe to RSS Feed
- Mark as New
- Mark as Read
- Bookmark
- Subscribe
- Printer Friendly Page
- Report to a Moderator
- Subscribe to RSS Feed
- Mark as New
- Mark as Read
- Bookmark
- Subscribe
- Printer Friendly Page
- Report to a Moderator
University: Duke University
Team Member(s): Tafadzwa Chaunzwa
Faculty Advisor: Dr. Kathy Nightingale
Email Address: tlc21@duke.edu
Abstract
Radiation force can be used to remotely perturb tissues or tissue mimicking materials. The rate at which the subsequent shear waves propagate within the medium can be directly correlated to the material’s stiffness. Tissue stiffness can in turn be used for various diagnostic purposes such as cancer lesion detection or liver fibrosis staging. To date, most studies in Acoustic Radiation Force Impulse Imaging (ARFI) have been based off of 2D displacement and shear wave tracking. With the advents of 3D ultrasound however, 3D shear wave tracking became a possibility. The multitude of advantages of volumetric sh ear wave tracking far outweigh the added cost of having elements in both lateral and elevations dimensions of an ultrasound transducer or other additional systems requirements. It also goes without saying; the shear novelty of 3D volumetric shear wave tracking is motivation enough for this project.
3D ultrasound probes are not inexpensive however, and in using them to generate ARFI pushes you run the risk of extensively damaging them. To avoid this, a High Intensity Focused Ultrasound (HIFU) piston would be used to generate an ARFI push for the 4Z1c ( a 3D probe), which would then be responsible for tracking the propagation of the subsequent shear wave. This project was centered on developing an integrated HIFU Piston - 3D Ultrasound system that would be able to allow for 3D volumetric shear wave tracking. A Pulse Counter device as well as several computer programs were developed (primarily in LabVIEW) to effectively synchronize the piston with the 3D probe. This system was able to meet all its design specifications and function as expected. Using this set up it was possible to realize the first volumetric shear wave tracking for the purposes of tissue elastography and diagnostic imaging. The acoustic energy out of the piston is modulated to “safer” ARFI ISPPA ranges and used to generate an ARFI push for the 3D probe (4Z1c Transducer) which then tracks the shear wave as it propagates through different mediums. LabVIEW was employed to run the set up's function generator and pulse counter device, as well as develop a graphical user interface for the experimental set up.
Development and Implementation
Several distinct steps (sub-projects in themselves) were followed in developing the set up. These steps included the acquisition of all essential hardware components including a state of the art Agilent Arbitrary function generator, calibration of the HIFU piston itself, the design and building of a Pulse Counter device, development of drivers for the Function Generator and the Pulse Counter and development of a composite Graphical User Interface (GUI).
What follows is a detailed description of each of the key steps followed in the development of the HIFU-3D probe set up which will be referred to as “The Set up” in much of this report.
Methods
Before proceeding to the specific developmental steps it is essential that a clear understanding of the functionality of the set up is developed. To this end a brief background on how the SC2000 scanner works is necessary.
When imaging is initiated the scanner sends a train of electric pulses to the transducer (in this case - the 4Z1c 3D probe). These pulses continuously excite the transducer, which in turn vibrates at its resonance frequency. The resultant mechanical vibration end up in energy being coupled into the body and a pulse echo sequence is used to come up with ultrasound images. The frequency of the pulse excitations coming from the scanner is often referred to as the PRF (Pulse Repetition Frequency) and is essential to the development of the HIFU-3D probe set up as shall be seen shortly.
Central to the implementation of the HIFU-3D probe set up is the ability to take advantage of the pulse train from the scanner to synchronize the scanner with the HIFU piston. If the function generator is able to trigger and send a burst waveform to the HIFU piston via an amplifier only when given a certain signal from the scanner, it is possible to fully synchronize the two. To this end the pulse train coming from the scanner can be used as a trigger signal for the function generator which in turn sends the drive signal for the HIFU piston to generate an ARFI push. Since all these pulses are identical in amplitude and period, a “Pulse Counter” was needed to decide which of these pulses will be used as the trigger signal for the function generator. The Pulse Counter needed to have the ability to fully discriminate which pulses to trigger on and thus essentially give the user control over when to generate the “ARFI push” after imaging was initiated on the SC2000.
Flow Chart
The following flow chart gives a schematic view of the set up.
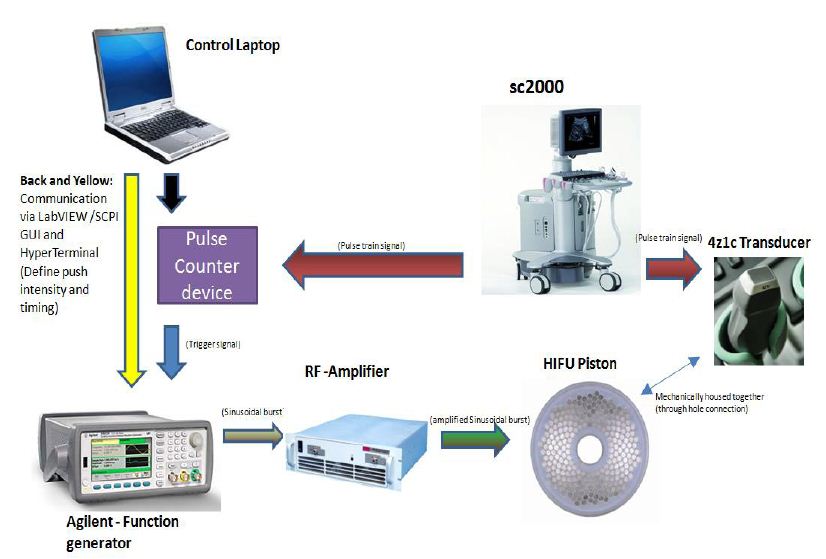
Figure.1: HIFU -3D probe system flow chart
Hardware Note: The 3D probe and HIFU piston were mechanically housed together as can be seen in the image below, with the 4Z1c probe going through the hole on the piston. Also note the HIFU piston in the flow chart above is for illustration purposes only and a different single element HIFU piston (shown below) was used in this project.
Figure.2: High Intensity Focused Ultrasound (HIFU) Piston
HIFU Piston water demo (fountain)
Agilent 33522A Function generator
The Agilent 33522A arbitrary Function Generator was employed in this set up. This device has the intrinsic ability to send out a burst waveform (whose parameters can be defined on its front panel) and allows for external rising edge triggering for this burst to be sent out. However there are currently no LabVIEW drivers to control the device on a computer (PC). Since it may be tedious and even difficult to always define the burst waveform and all its parameters directly onto the device, being able to control the function generator using a PC was desirable. It was thus necessary to develop drivers to be able to run the function generator by easily inputting numeric values on the front panel of a graphical user interface (GUI) on a computer screen and set it to external triggering among other things.
This goal was accomplished by using the VISA resources in NI’s LabVIEW to connect to the device and Standard Commands for Programmable Instrumentation (SCPI) to program the instrument. SCPI syntax was sent at different stages of the program using VISA-write virtual instruments. Figure .3 below shows a single case Block Diagram of the program that was written.
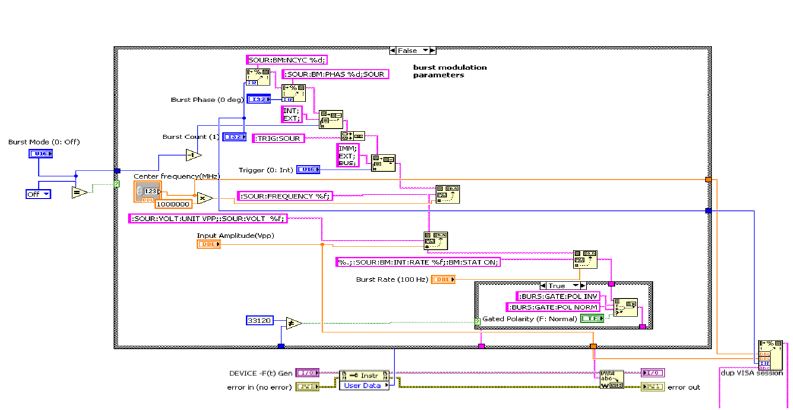
Figure.3: Function Generator drivers in LabVIEW (Block diagram)
This program was able to offer the user full access to the device’s key functions from a computer, where variables could easily be defined and other low level commands could be sent.
HIFU Piston Calibration
In developing this system it was imperative to take into consideration the fact that a HIFU piston is a therapeutic device. With that in mind it was necessary to make sure that for our purposes, the device would only run at ARFI intensity ranges (ISPPA values roughly between 1000- 2000 W/cm^2) .
Figure.4 below shows the experimental set up used to calibrate the HIFU piston.
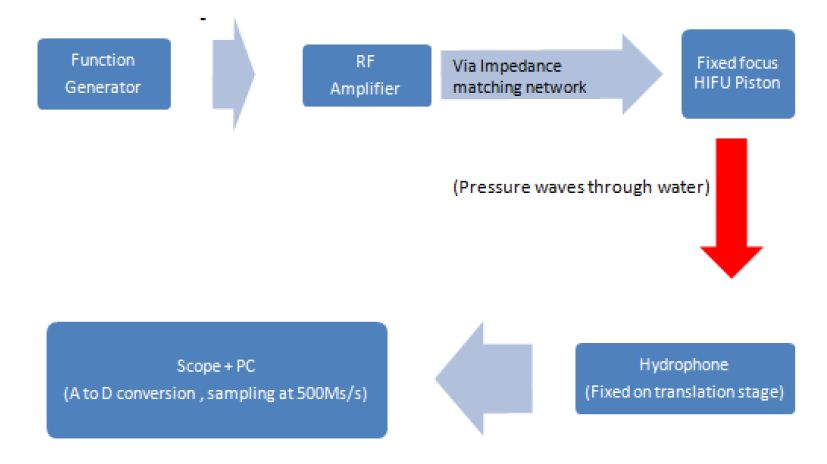
Figure.4: HIFU calibration experimental set up schematic
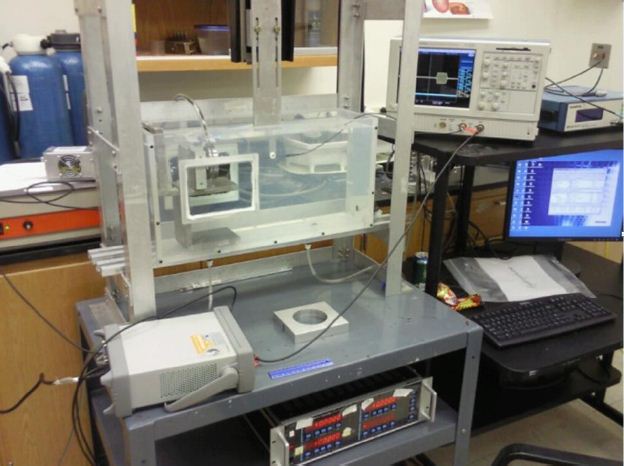
Figure.5: HIFU Calibration set up (note the needle hydrophone on translation stage)
As can be seen from the flow chart above, a function generator was used to send a burst waveform to run the HIFU piston. This signal was first amplified to varying degrees by an RF amplifier and which was in turn connected to the HIFU piston via an impedance matching network. The fixed focus HIFU piston (which was placed in a water tank) would then radiate acoustic waves through the aquatic medium. Located at the focal location of the HIFU piston was a needle hydrophone sensor fixed on a translation stage. This hydrophone sensor would then be able to convert energy received as pressure waves into an electrical signal read on an oscilloscope and stored in text format.
Varying the amplitude of the signal coming from the function generator and holding the amplifier’s gain constant ( maximum gain of the RF Amplifier available) it was possible to induce different intensity outputs from the HIFU piston and note its behavior. The
received signal on the oscilloscope was processed using matlab (see code in appendix) to come up with observed ISPPA values in each instance.
The burst wave forms were all set to 10 cycles long and in different experiments ran at each of the two harmonics of the HIFU piston (1.1 MHz and 3.4 MHz). Due to the non linearity of the received waveforms, observed transient behavior, and varying amplitudes ( as shown in Figure 6 below) a relatively uniform region in each of the received was forms was extracted using a correlation method described in the code attached.
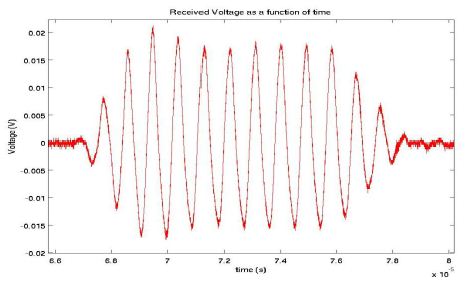
Figure.6 : received wave form on Oscilloscope
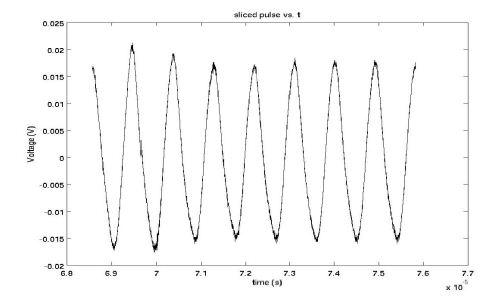
Figure.7: Sliced (to uniform amplitudes) received waveform for the purposes of ISPPA calculation.
The received pressure values were calculated from the received voltage readings using, P = ΦV, where The calibration factor, Φ=106 ψ ω /20 and ψ(ω) is the Hydrophone sensitivity in dB re V/μPa - a frequency dependant quantity(see frequency dependence curve for needle hydrophone in appendix). The intensity would then be calculated using, I = <P^2> /Z = <P^2> /ρc, where the density, ρ and speed of sound in water, c are assumed to be 1000 kg/m^3 and 1490 m/s respectively.
Figures 8 and 9 below show the resultant ISPPA data that was obtained using an amplifier that is currently in the lab’s possession. Figure 9 shows the observed peaks (both +ve/-ve) for each received waveform and serves as evidence of the non linearity observed during this exercise.
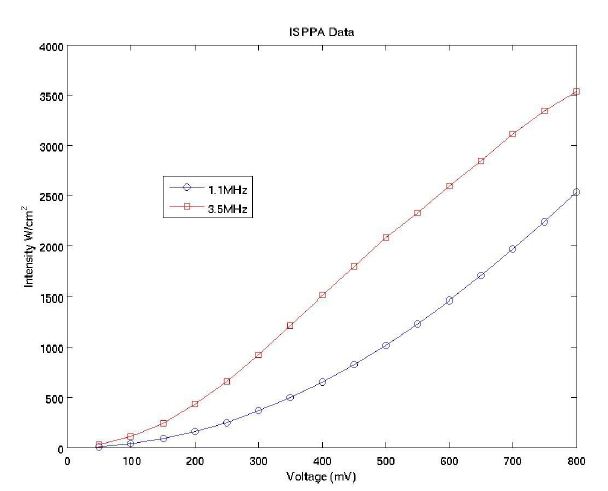
Figure.8: Intensity as a function of output voltage on the Function Generator (Constant gain on amplifier)
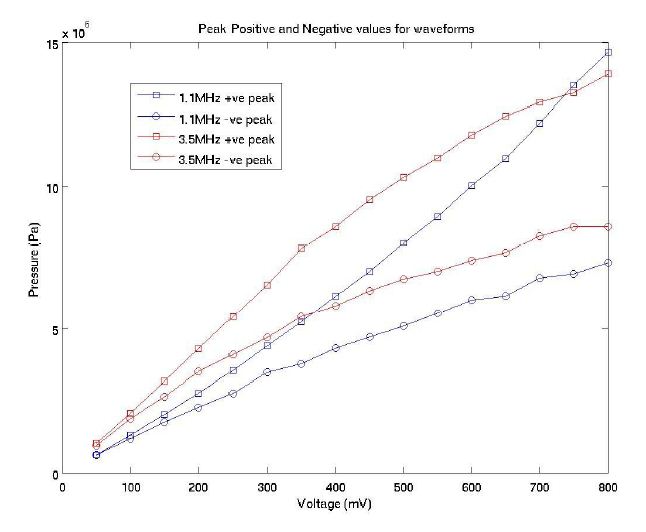
Figure.9: Positive and negative peaks pressures of received waveforms as a function of output voltage on the Function Generator (Constant gain on amplifier)
The information from this calibration exercise would then be used each time the piston is employed in generating ARFI pushes and modulate its output intensity when running the HIFU set up.
Pulse Counter
The Pulse Counter Device was made to meet several specifications. Chief to these was the need for the device to be able to offer temporal discrimination between pulses from the SC2000 ultrasound system, and output a trigger pulse to the signal generator at a time, t after imaging is initiated. In addition, the device needed to include a full manual control unit (Control buttons, LCD display, Reset portal). The device would also need to be connected to both the scanner and the function generator via BNC RF connectors. To assure the user of its functionality, the Pulse Counter Device also needed to buzz when being operated, and light a red light emitting diode when enabled to trigger or activated. A voltage regulator was to be included for device safety considerations. Also to ensure the device’s ability to communicate with a PC, the device needed to include RS232 serial port connectivity via DB9 connectors.
ExpressSCH and ExpressPCB were used to come up with the schematic and PCB circuit design for the Pulse Counter.Figures 10 and 11 show the Schematic and PCB circuit designs that were developed. This design stage was crucial to the overall functionality of the resultant device hence extra caution was taken during this step to ensure success of the overall effort.
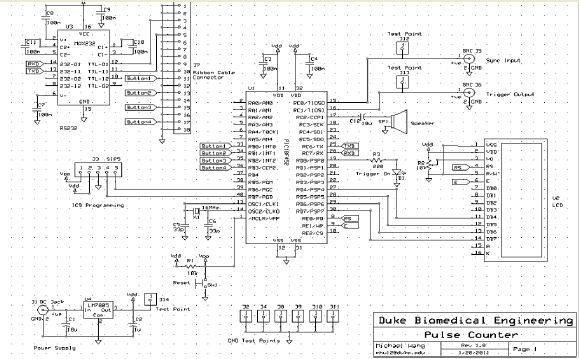
Figure.10: Pulse Counter Circuit Schematic
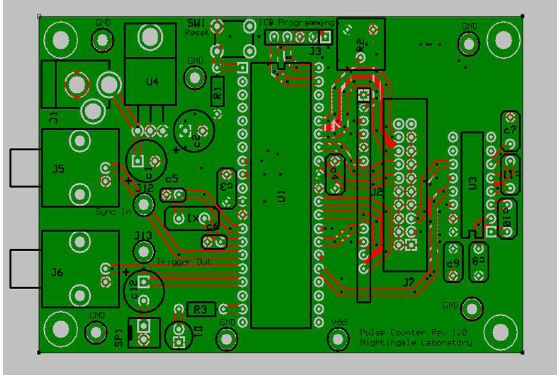
Figure.11: Pulse Counter Circuit PCB design
After the initial design step, all the components of the circuit (see appendix for full list) were soldered onto the Printed Circuit Board (PCB) using a through hole soldering technique. A C program developed in MPLAB was then installed onto a 40 pin Programmable Integrated Circuit (PIC) which could in turn be reversibly installed onto the remainder of the circuit via a 40 pin dip socket. Also part of the circuit, was a 16 pin PIC which was preprogrammed for RS232 connectivity.
The circuit was then tested using a digital multimeter and oscilloscope before being tested for its intended function. Once the functionality of the circuit was established, a transparent poly carbonate enclosure was built to house the circuit. The two images (Figure.12 and 13) below show both the preliminary circuit and the final product.
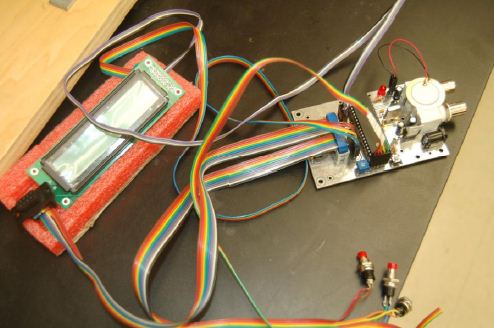
Figure.12: Preliminary “Naked” circuit
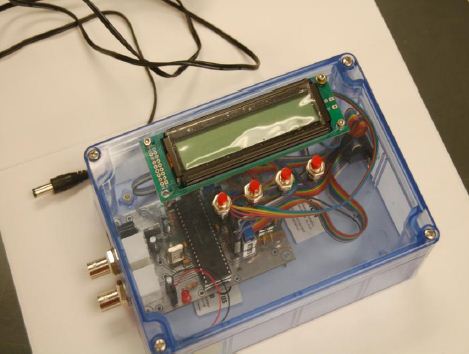
Figure.13: Final Pulse Counter Device
After the device was seen to function well and meet all its other design specifications, it was now necessary to ensure that the Pulse Counter could be interfaced with a PC via the RS232 serial port. This would be necessary in cases where the HIFU-3D probe set up needed to be run from a single user interface on a PC along with other components of the set up. Using a Windows Hyperterminal, it was possible to “talk” to the device
using relatively low level commands with their respective terminating characters. Sending commands like e/r/n would enable the device to trigger while specifying #/r would be necessary to set the trigger number on the device to a certain value #. Besides the difficulty of interfacing it with other programs for parallel control of multiple devices, the Hyperterminal also offered little flexibility when running the device for those not too familiar with the specific syntax for sending commands to it.
It was thus necessary to come up with a much more user friendly PC - Pulse Counter communication line. To this end, LabVIEW drivers were created for the device along with a compact Graphical User Interface. Again the VISA resources in LabVIEW were employed to write to and read from the device. Establishing RS232 connectivity in Labview is known to be non trivial and complex structures were used to allow this connectivity. The program shown in the Figure 13 below was employed and used to meet this goal.
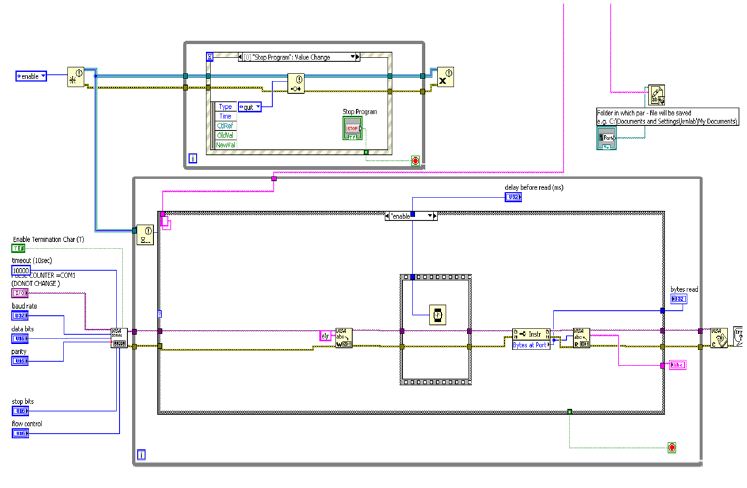
Figure.14: Pulse Counter LabVIEW drivers (Disregard the incomplete connections, these were used in a stage that will be presented later)
Using Labview it was now possible to toggle Boolean controls and press buttons to run operations that would have otherwise required a clear understanding of the command syntax for the device.
Graphical User Interface
What follows is an extensive account of what the resultant system was able to achieve and the functionality of the HIFU-3Dprobe set up via a Graphical User Interface (GUI). Please proceed to the user guide section for concise step by step instructions on how to operate the system.
After drivers were written for both the Function Generator and Pulse Counter, it now remained to integrate these programs to come up with a composite graphical user interface in LabVIEW. This GUI would allow the user full control over both devices and consequently the entire HIFU set up. Figure X below shows the front panel to this GUI which allowed the user to set parameters for the whole set up and enable it to trigger on the go from whenever the scanner is set to initiate imaging.
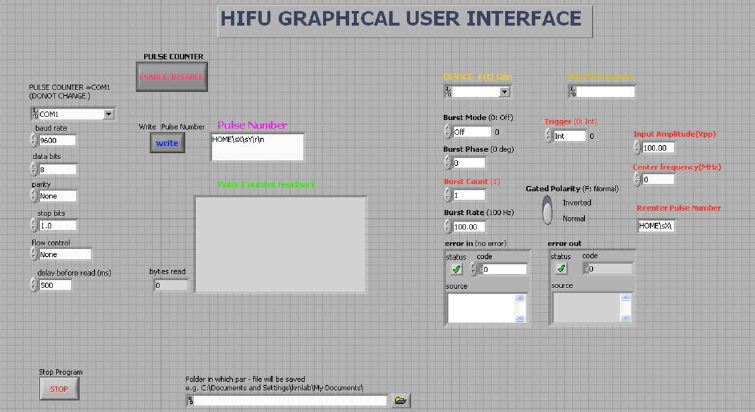
Figure.15: Graphical User Interface (Some low level components such as Burst Phase specification may be removed/excluded in later versions of this GUI)
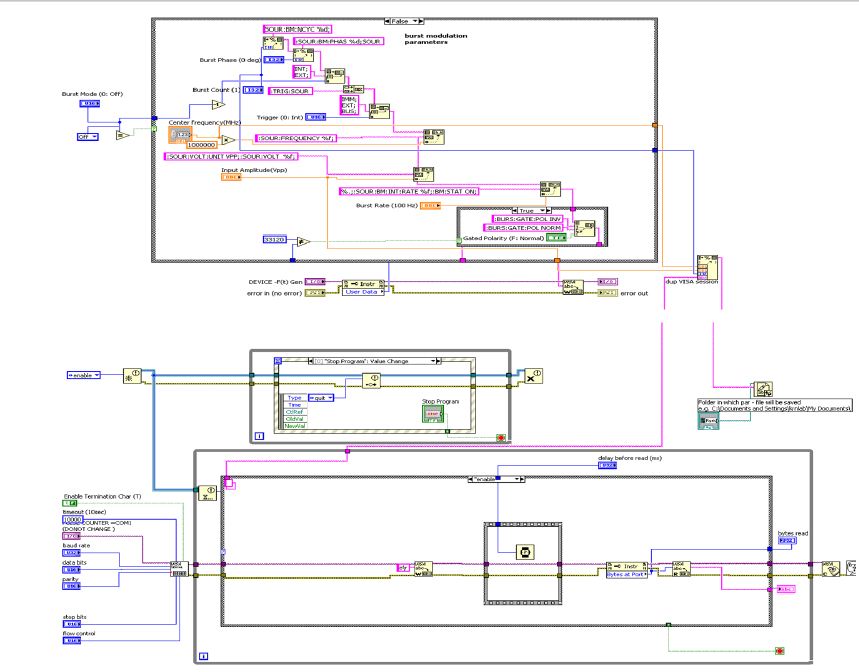
Figure.16: Composite LabVIEW block diagram for HIFU-3D probe user interface.
From the front panel, users can enter HIFU push parameters such as Frequency, Amplitude/Intensity of the push, burst duration, set the Function generator to accept external triggering among other things. The program will automatically save all the specified user inputs if the user specifies where they would want a text file with the pertinent parameters to be created.
The GUI also has an indicator (“dups VISA session”) that will let you know if you have been successfully connected to the Function Generator. When you hit “write” on the front panel while the program is running, you will also get feedback from the Pulse Counter, confirming your commands have been received, and the instrument’s response to this action will be displayed in this window. This “Dialogue Window” will provide the user with information on the Pulse Counter device’s proper use should need arise. For instance if the user tries to change the pulse number after the system has been enabled/activated, the Dialogue Window will inform the user of this and ask them to disable the system first before they can change any parameters. There is also an error indicator in case there may be any problems with sending commands to either device. Errors of this form are very unlikely except in cases where the hardware might have been changed (e.g. if a different Function Generator is used) or if proper hardware connections have not been made. Writing to the Pulse Counter will be done only when the LabVIEW program is running hence it is imperative that the user leave the program running in order to write to the Pulse Counter. Hitting the “Stop” button on the front panel will stop the program and write the final “Parameters File” to a user specified location on the laptop hard drive.
Results and Conclusions
From this project we were able to realize volumetric shear wave tracking. Following the multitude of steps it was possible to come up with a robust integrated system that allows the user full control over ARFI push generation in relation to 3 Dimensional ultrasound imaging using the 4Z1c probe. All the design specifications of the set up were met, and the integrated HIFU -3D Probe system should be readily available to Lab members that will need to carry out studies that involve 3D volumetric shear wave tracking.
Sample Coronal_shear_wave
# Attached is a more detailed technical report for the study #
- Mark as Read
- Mark as New
- Bookmark
- Permalink
- Report to a Moderator
Hello there,
Thank you so much for your project submission into the NI LabVIEW Student Design Competition. It's great to see your enthusiasm for NI LabVIEW! Make sure you share your project URL with your peers and faculty so you can collect votes for your project and win. Collecting the most "likes" gives you the opportunity to win cash prizes for your project submission. If you or your friends have any questions about how to go about "voting" for your project, tell them to read this brief document (https://forums.ni.com/t5/Student-Projects/How-to-Vote-for-LabVIEW-Student-Design-Projects-doc/ta-p/3...). You have until July 15, 2011 to collect votes!
I'm curious to know, what's your favorite part about using LabVIEW and how did you hear about the competition? Great work!!
Good Luck, Liz in Austin, TX.
- Mark as Read
- Mark as New
- Bookmark
- Permalink
- Report to a Moderator
Awesome work
