- Document History
- Subscribe to RSS Feed
- Mark as New
- Mark as Read
- Bookmark
- Subscribe
- Printer Friendly Page
- Report to a Moderator
- Subscribe to RSS Feed
- Mark as New
- Mark as Read
- Bookmark
- Subscribe
- Printer Friendly Page
- Report to a Moderator
Digital Frequency
Overview:
This document discusses basic frequency theory and applications, and explains how to use the myDAQ or ELVIS II series to obtain digital frequency measurements. The frequency data will be acquired using the DAQ Assistant that is installed into LabVIEW with the NI DAQmx driver.
Purpose:
Use the myDAQ or ELVIS II series to output a digital signal with a specific digital frequency to a protoboard, and then read the signal through the same instrument into LabVIEW.
Background:
Frequency Defined
Frequency is the rate of recurrence of a cyclic or periodic event. In physics, you can observe periodicity in rotations, oscillations, and waves. For an analog or digital waveform, you can invert the signal period to obtain the frequency. The smaller the period, the higher the frequency and vice versa. This is illustrated in Figure 1, with the top waveform having the lowest frequency and the bottom waveform having the highest frequency.
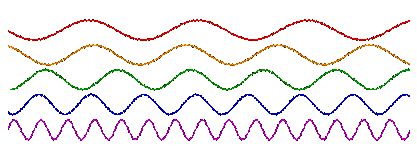
Figure 1: Waveforms with Frequency Increasing from Top to Bottom
Frequency is usually represented as angular frequency ω in radians/second, or as ƒ in seconds-1, also known as the unit hertz (Hz). You also can use beats per minute (BPM) and revolutions per minute (RPM) to represent frequency. Angular frequency ω (rad/sec) and ƒ (Hz) are related by the following formula: ω =2πƒ. Frequency is also spoken of in correlation to a phase φ, which describes an offset of the wave from a specified reference point at the initial time t0, and is usually given in degrees or radians. Taking the example of a sinusoidal wave, the waveform function is expressed in terms of time as , with amplitude A, angular frequency ω, and phase φ as constants.
Periodic analog signals in real applications are complex and can rarely be represented by a simple sinusoid. Fourier analysis is used to decompose any complex waveform into a sum of simpler functions, either sines and cosines or complex exponentials. The frequency components that make up such a signal are often the properties of interest, and this analysis is known as frequency-domain or spectral analysis. This type of analysis is required mainly for sound and vibration and is not examined in this document.
Obtaining the frequency of a digital signal, on the other hand, is quite simple. For a simple digital signal, such as the one depicted in Figure 2, the period is simply the time between rising edges, or even falling edges.
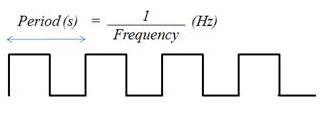
Figure 2: Digital Waveform
If the time between rising or falling edges varies slightly, you can average it over a large number of samples to determine the frequency.
Applications of Frequency Measurements
Frequency measurements have a variety of applications. Radio communication operates by transmitting signals of specific frequencies, so being able to determine the frequency of the signals is key to interpreting the information. Quadrature encoders are a perfect example of a digital signal frequency application, as they measure position, direction and motion with frequencies of square-wave pulses. The possibilities for frequency measurement applications are endless.
Equipment:
- NI myDAQ or NI ELVIS II
- LabVIEW
- Wire
- Breadboard
General Measurement:
For our application of digital frequency acquisition, the process is fairly simple. For low-frequency signals, it is sufficient to use one counter, or timebase. The rising edge of the input signal triggers the number of timebase ticks to be counted. Because the timebase is of a known frequency, you can easily calculate the frequency of the input signal (see Figure 3).
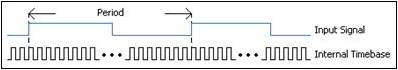
Figure 3: Digital Signal with Respect to Internal Timebase (One Counter for Low Frequency)
When the frequency of the digital signal is very high or varies, it is better to use one of the two-counter methods described below. Note that the same hardware limitation applies to both two-counter methods. That is, the frequency you are measuring cannot exceed the maximum input frequency supported by the counter, even though it may exceed that of the internal timebase.
High-Frequency Two-Counter Measurement Method
For a high-frequency signal, you need two counters. A paired counter (two counters) generates a pulse train with a user-specified period, “measurement time” (see Figure 4), much larger than that of the signal you are measuring but small enough to prevent counter rollover.
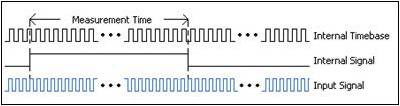
Figure 4: Digital Signal Frequency Measured with Two Counters (High Frequency)
The measurement time of this Internal Signal should be a multiple of the Internal Timebase, or, in other words, divided down. The number of ticks of the Input Signal is then counted over the known period of time provided by the Internal Signal. Dividing the number of ticks by the known measurement time gives the frequency of the Input Signal.
Large-Range Two-Counter Measurement Method
For signals with variations in frequency, this two-counter method provides increased accuracy throughout the entire range. The Input Signal in this case is divided by a known value, or divisor. The number of ticks of the Internal Timebase is counted over one logic-high of the Divided Down Signal (see Figure 5). This gives the time of the logic-high, which is the product of the number of ticks counted and the period of the Internal Timebase. This in turn can be multiplied by 2 to get the period for the Divided Down Signal (high and low time), which is a multiple of the Input Signalperiod. The Input Signal’s period can then be inverted to obtain its frequency.
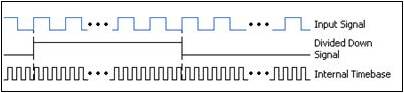
Figure 5: Digital Signal Frequency Measured with Two Counters (Large Range)
This method is like averaging the values over a longer range to account for the variation in the signal, but you can also use this method to measure signals with higher frequencies than the timebase.
Using the NI myDAQ Counter
The NI myDAQ is equipped with one on board counter that can be used for counter/timer functions. Because only one counter is available, the large-range and high-frequency two-counter methods may not be used with the NI myDAQ. The counter can be accessed by using DIO 0, DIO 1, and DIO 3 to interface with the three counter lines inside the NI myDAQ.
When using the counter/timer, the Source is accessed through DIO 0, the Gate through DIO 1, the Auxiliary Input through DIO 2, the Output through DIO 3, and the Frequency Output through DIO 4. When using the counter/timer as a quadrature encoder, A, B and Z correspond to the Source, Gate and Out lines, respectively.
In some instances, the NI myDAQ software and drivers may refer to the output lines as PFI lines as opposed to DIO. Refer to Table 1 for a list of the corresponding counter/timer signals through the DIO terminals.
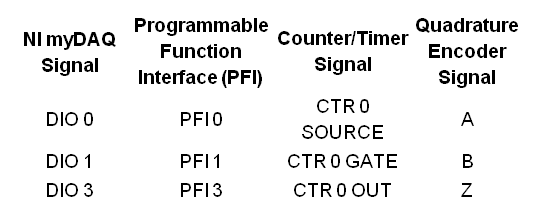
Table 1: NI myDAQ Counter/Timer Signal Assignments
The NI myDAQ counter can be used for nine different counter tasks. These tasks include:
- Taking an edge count on a digital input
- Measuring the digital frequency of an input
- Measuring the period of a digital input signal
- Measuring the pulse width of a digital input
- Measuring two-edge separation of two digital signals
- Measuring position with a signal from a linear encoder
- Measuring position with a signal from an angular encoder
- Generating a pulse Output
Different tasks will require different inputs to be connected to the three counter terminals of the NI myDAQ.
If you are using the myDAQ's counter with the DAQ Assistant Express VI, then the DAQ Assistant will show which lines need to be connected for each type of counter task. For example, the counter can configured to count edges by placing a DAQ Assistant VI on the block diagram and selecting Acquire Signals » Counter Input » Edge Count, and then selectiong ctr0 on your NI myDAQ. The DAQ Assistant will then show that the input must be connected to PFI0, which corresponds to DIO 0. The NI myDAQ counter can only acquire one sample at a time, due to the lack of a FIFO buffer (NI ELVIS II has this).
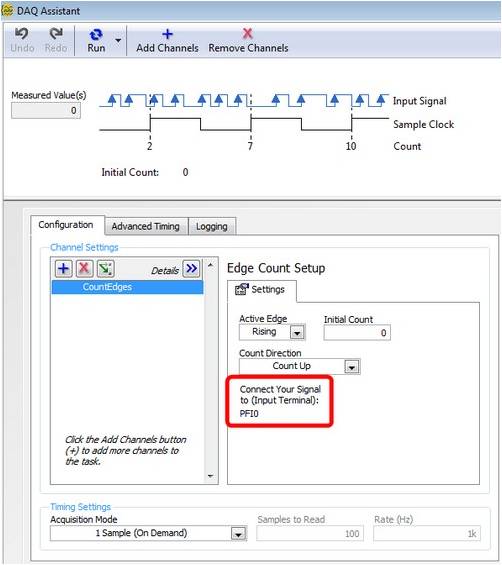
Figure 4: Configuring the myDAQ counter for counting edges
Using the NI ELVIS II Counter
The NI ELVIS II is equipped with two on board counters that perform the same functions as the counters on the NI myDAQ. There are a few differences, however, and some added functionality:
- The timer inputs/outputs are solely from the PFI lines, rather than the DIO lines.
- Because two counters are available, the large-range and high-frequency two-counter methods may be used with the NI ELVIS II.
- The counter may acquire more than one sample, because the NI ELVIS II has a FIFO buffer.
Refer to Table 2 for a list of the corresponding counter/timer signals through the PFI terminals.

Table 2: NI ELVIS II Counter/Timer Signal Assignments
Set Up Hardware:
For simplicity, we will use the NI myDAQ or ELVIS II Frequency Generator (FGEN) rather than create an external waveform source like a timer IC. For the NI myDAQ, simply wire AO0 (FGEN) to DI1 (counter).
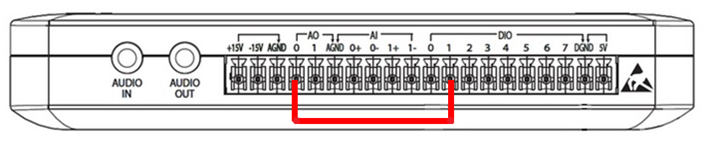
Figure 5: NI myDAQ Wiring Diagram
For the NI ELVIS II, simply wire the FGEN pin to PFI 8.
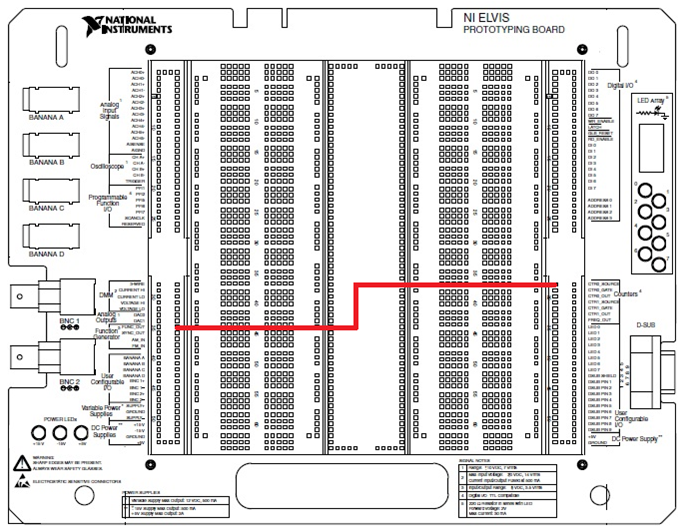
Figure 6: NI ELVIS II Wiring Diagram
Software Instructions:
LabVIEW User Interface
The LabVIEW program can be constructed using either the NI-DAQmx function library or the DAQ Assistant. Attached to the bottom of this page are two VIs--one using the NI-DAQmx function library and the other using the DAQ Assistant. The user interface we created shows the value of the frequency measured by DI1, and plots the value on a waveform chart. As you can see below, the program that uses the NI-DAQmx function library provides more control to the user.
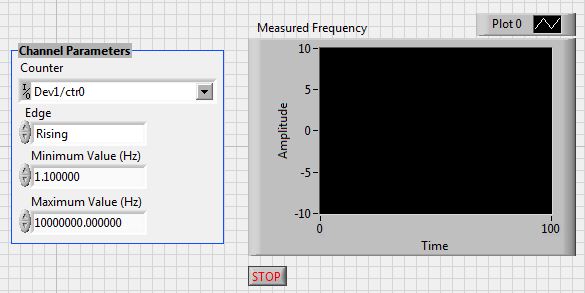
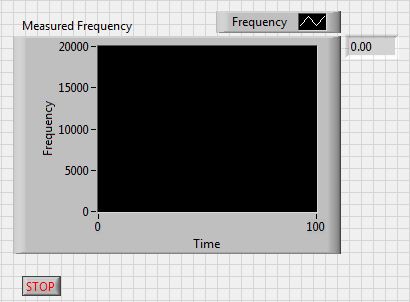
Figure 7: Frequency Measurements DAQmx.vi (top) and Frequency Measurements DAQ Assistant.vi (bottom) front panels
Coding Strategy
In LabVIEW, we need to first need to output the analog voltage waveform from the FGEN to our NI myDAQ using the DAQ Assistant. We then calculate and display the frequency of the signal.
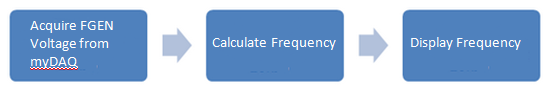
Figure 8: Coding Diagram
The coding diagram is then translated into LabVIEW code. As you can see below, the program that uses the DAQ Assistant is simpler and easier to understand.
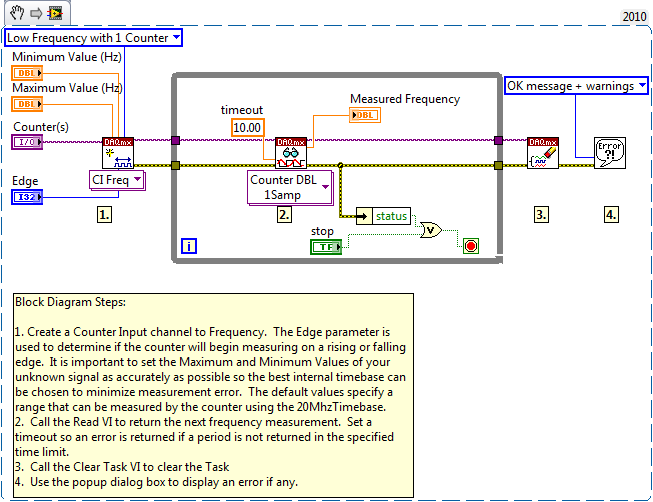
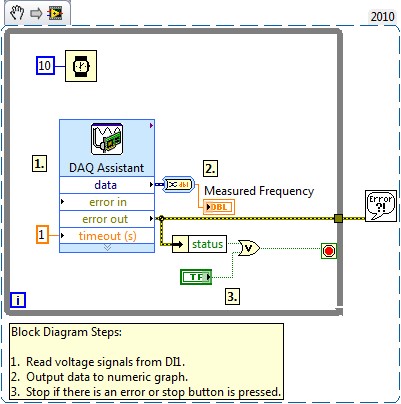
Figure 9: Frequency Measurements DAQmx.vi (top) and Frequency Measurements DAQ Assistant.vi (bottom) block diagrams
How It Works:
To understand the application, we must first discuss the configuration of the FGEN and frequency counter. The FGEN outputs a sine wave, square wave, or triangle wave at a specified amplitude and frequency. Both amplitude and frequency are adjustable by our application, but we will specify that the FGEN must output a square wave, since we are dealing with digital frequency measurements. While running the program, the amplitude should be greater than 3.3 V, which represents a digital HI, or else the frequency counter will be unable to accurately detect a frequency. The FGEN can be found by searching for ‘function generator’ in the search palette. The frequency counter is run through the DAQ Assistant, and was previously explained in the ‘General Measurement’ section.
Set Up DAQ Assistant
- Be sure your myDAQ or ELVIS II is plugged in
- Press Ctrl-Space to bring up the Quick Drop Window (takes a full minute to load on the first use)
- Search for DAQ Assistant and double click on it when it appears in the list
- Drop it on the Block diagram (white window)
- When the Create a New Express Task configuration pane appears, select
- Acquire Signals
- Counter Input
- Frequency
- Dev 1 (NI myDAQ or ELVIS II) *Note: If you have other NI hardware installed, the myDAQ or ELVIS II may not be Dev1.
- Ctr0
- Finish
- Change the Frequency Input Setup to the correct Signal Input Range
- Max: 20 kHz
- Change Timing Settings to
- 1 Sample (On Demand)
- Press OK
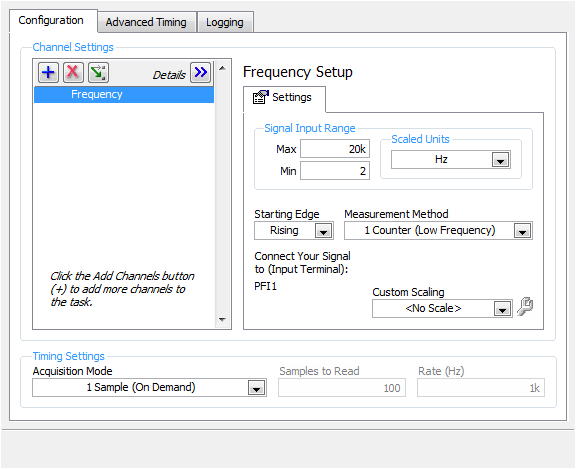
Figure 10: DAQ Assistant Frequency Configuration
*Note that sample time is set by the Wait VI and is set to sample 100 times per second (every 10ms) in this VI
Set Up Function Generator
- Open the FGEN from the NI ELVISmx Instrument Launcher.
- Adjust the settings to match those seen in the diagram shown below.
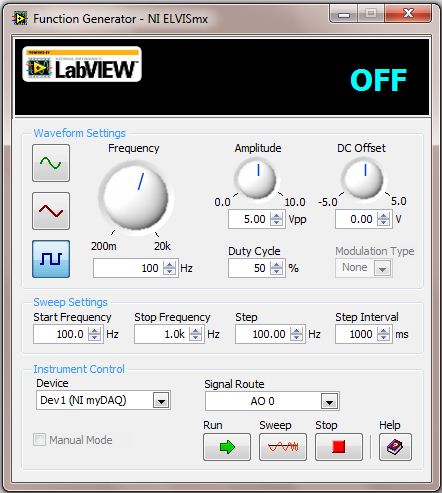
Figure 11: NI ELVISmx FGEN configuration
Run the Program
- Run either of the frequency VIs.
- Run the FGEN.
- Adjust the frequency of the FGEN, and observe the measured frequency on the front panel of the VI.
Tips and Tricks:
- Experiment with different voltage levels and waveform types.
- You can modify the VI to log the data to file using a ‘Write To Spreadsheet File.vi’ express VI if you wish to save the data. Be sure to place it in the loop and be sure to append new data to the spreadsheet file.
- Expand your application by integrating more functionality into the VI. Possible scenarios might include measuring the number of pulses in a given time period or making the application perform different tasks at different frequencies.
Webcasts, Tutorials, and Other How-To Resources
Making Accurate Frequency Measurements
Learn About Relevant Training Options: Data Acquisition and Signal Conditioning
Applications Engineering
National Instruments
