Overview
This example demonstrates how to build a customized color bar chart.
Description
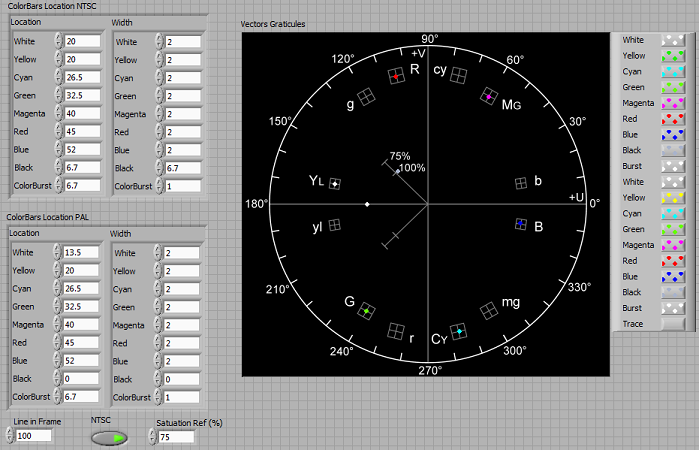
This example code seperates the controls in the Vector Plot Control and allows the user to create a customized color bar chart to display waveforms. This example requires Video Measurement Suite installed and is very useful when trying to build a custom control for the Vector Scope Plot to utilize custom colors.
Requirements
LabVIEW 2009 (or compatible)
Video Measurement Suite (VMS)
Steps to Implement or Execute Code
1. Open Custom ColorBar Vector Plot.vi
2. Verify the constants on the block diagram point to existing files (in Windows XP this will need to be changed)
3. Run the VI
4. Notice that the user can customize colors.
Additional Information or References
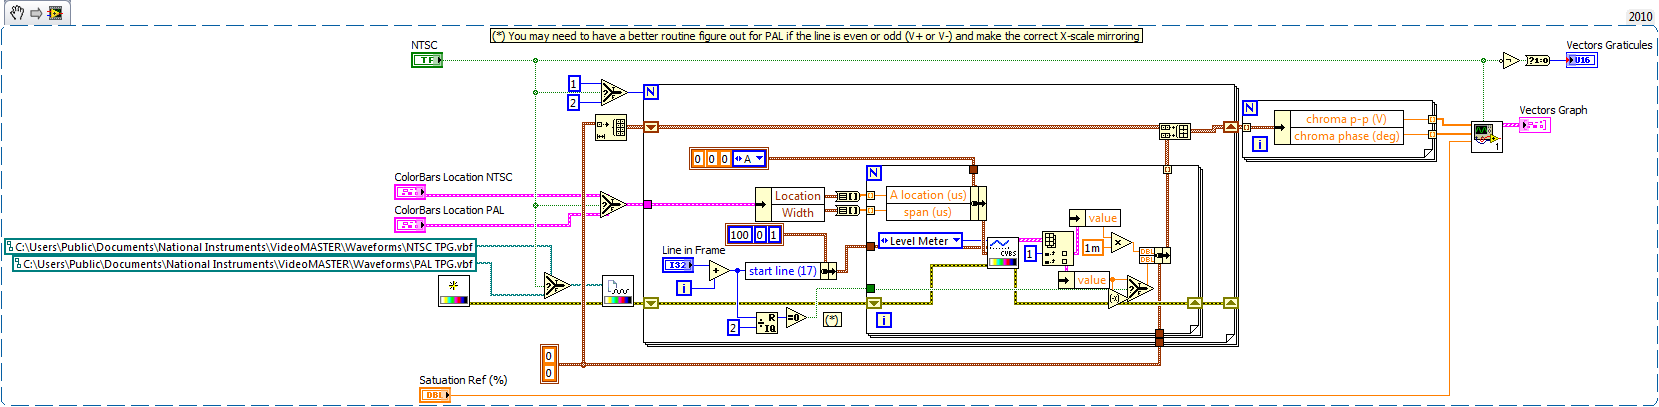
Note that this example uses the standard NTSC and PAL vbf files as an input but can be modified to use actual measured waveforms.
**This document has been updated to meet the current required format for the NI Code Exchange. **
