Overview
This example shows how to use the 3D Waterfall plot.
Description
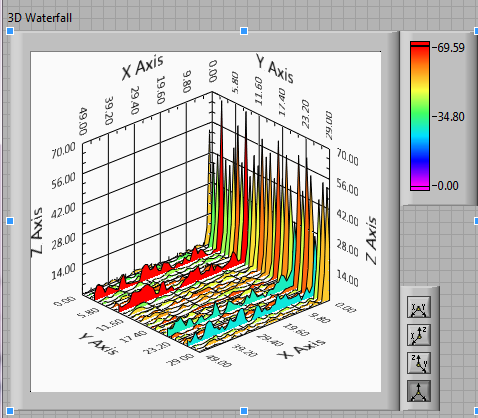
In this VI, two sine waves are generated -- 1 with periodic random noise, 1 clean sine wave. 20% of the time, we see the noisy sine wave, and 80% of the time, it's a clean one. We take the FFT of the signal to determine which frequencies we see our noise on.
Requirements
- LabVIEW 2012 Full Development System (or compatible)
Steps to Implement or Execute Code
- Run the VI and the 3D Waterfall control will display the surface of the FFT of the signal.
- The Graphs and Array on the right show the signals and FFT to help understanding the VI.
Additional Information or References
Front Panel
VI Snippet

**This document has been updated to meet the current required format for the NI Code Exchange.**
Che T.
Applications Engineer
National Instruments
