- Document History
- Subscribe to RSS Feed
- Mark as New
- Mark as Read
- Bookmark
- Subscribe
- Printer Friendly Page
- Report to a Moderator
- Subscribe to RSS Feed
- Mark as New
- Mark as Read
- Bookmark
- Subscribe
- Printer Friendly Page
- Report to a Moderator
Custom Probes datasheet

General Description:
Custom probe are really useful when you need to find bugs in your application. As we develop with LabVIEW since 1989 at SAPHIR, we are pleased to share with you the probes we use every day.
Most of these custom probes offers
- alternative way to display data
- quick way to freeze or clear graph indicator
- resize capabilities to improve data analize
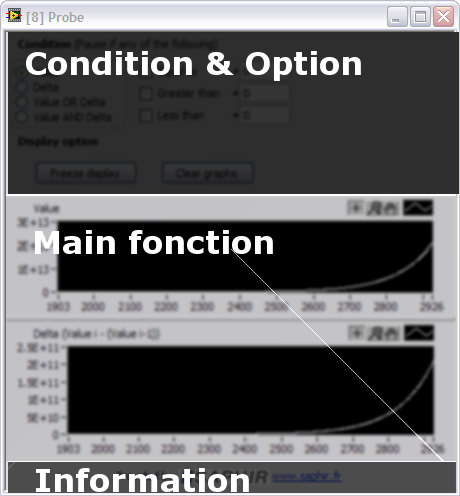
Each probe follows user interface guideline to find easily settings and information. From top to bottom, you'll find :
- Conditionnal probe settings (optionnal)
- Display option (optional)
- Data display
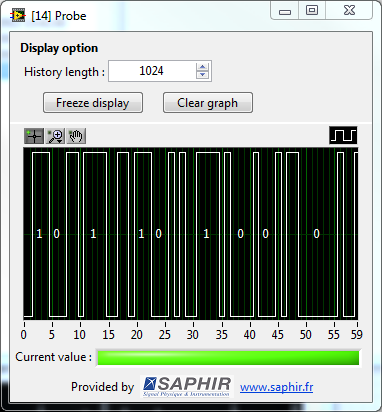
| Chronograph |
|---|
 |
|
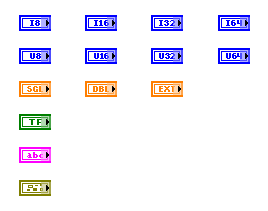
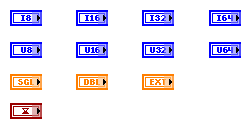
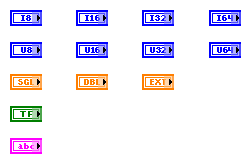
Supported wire type :
|
|
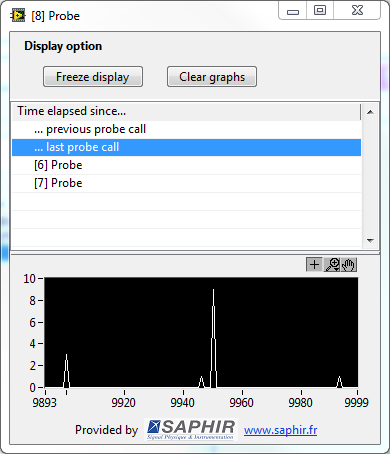
Description: The Chronograph probe measures code time execution:
It's a powerfull tool to quickly analyse code execution in your program. |
| Delta |
|---|
|
|
|
Supported wire type :
|
|
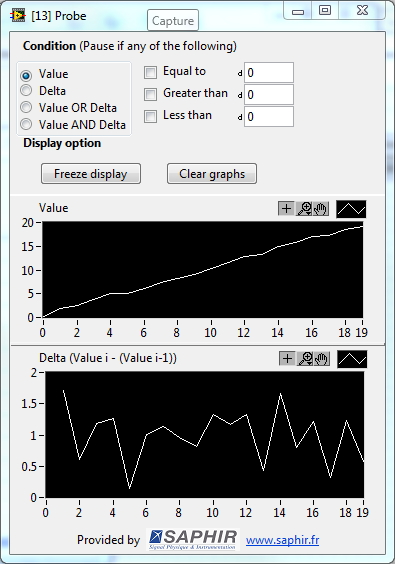
Option & Condition:
Display option: Stopping condition: Freeze display Value Clear graph Delta Value or Delta Value and Delta |
|
Description: The Delta probe displays evolution of current value monitored in the first graph and evolution between current value previous current value in the second graph. It's a powerfull tool to check delta evolution of numerics. |
|
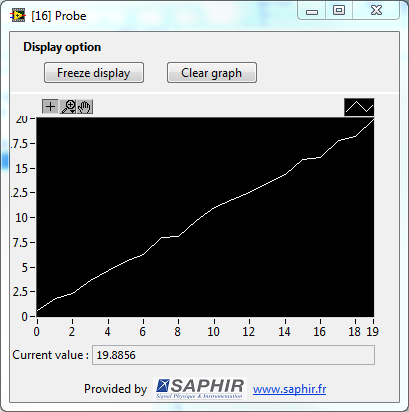
Graph |
|---|
|
|
|
Supported wire type :
|
|
Option & Condition:
Display option: Freeze display Clear graph
|
|
Description:
The Graph probe offers a graph display with the following features:
|
| History |
|---|
|
|
|
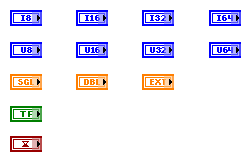
Supported wire type : |
|
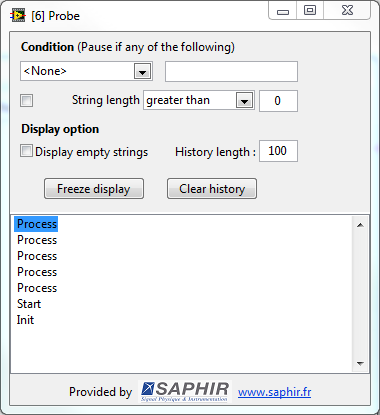
Option & Condition:
Stopping condition: Display option: Ends with Freeze display Equals Clear graph Starts Contains Match pattern String length |
|
Description:
The History probe keep in memory each string passed through the wire (most recent string at the top of the list). It's a powerfull tool to monitore state machine for exemple. |

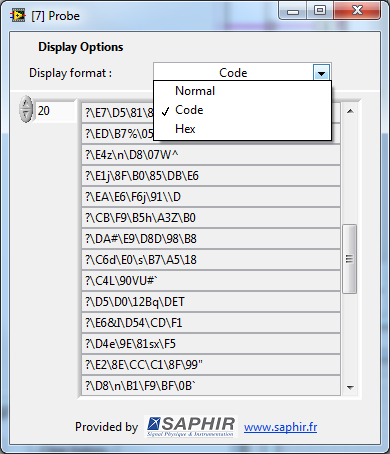
| Normal / Code / Hex Display |
|---|
 |
|
Supported wire type : |
|
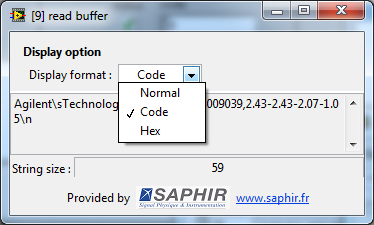
Option & Condition:
Display Option: Normal Code Hex |
|
Description:
The Normal/Code/Hexa display probe displays string in 3 different display mode:
Additionnaly the string size is calculated and diplayed in the bottom part of the probe window. |

:
| Resizable Array |
|---|
|
|
|
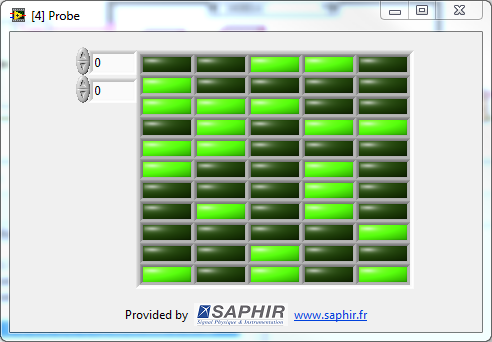
Supported wire type :
Note that 1D and 2D array are supported. |
|
Option & Condition:
Display Option: Normal Code Hex |
|
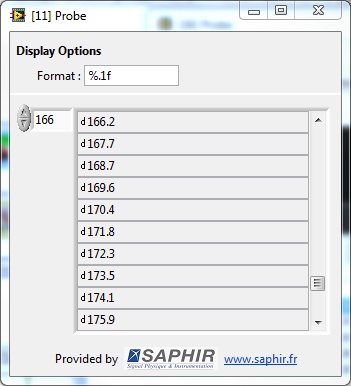
Description:
The resizable probe displays data in an array that shows more or less cells depending of the probe window size. This is a powerull tool to navigate through an array and see values next to the monitored index.
Note that you can change the display format for numeric an string data type |
Requierement
- LabVIEW version : 8.6 or later (Not compatible with the LabVIEW Real-Time Module)
- Operating System : Windows - Linux - Mac OS
- VI Package Manager from JKI - Community Edition For installation process
