- Document History
- Subscribe to RSS Feed
- Mark as New
- Mark as Read
- Bookmark
- Subscribe
- Printer Friendly Page
- Report to a Moderator
- Subscribe to RSS Feed
- Mark as New
- Mark as Read
- Bookmark
- Subscribe
- Printer Friendly Page
- Report to a Moderator
PXI Modular Instrument Implementation of an Impedance Analyzer
Contributors:
Jason Whaylen - National Instruments
Kalyanramu Vemishetty - National Instruments
Dean Homan
Todd Branson
Matt Cannon
Impedance measurements are needed in many different industries for communications or other characterization purposes. These uses span from design validation in R&D though testing components following manufacturing. The marketplace for instrumentation to perform low frequency (<10MHz) impedance measurements at an efficient price point has become increasingly void over the last decade as equipment providers continue to place additional focus on high-frequency RF systems. National Instruments has worked with its customers to develop a solution leveraging PXI modular instruments and graphical LabVIEW software to create a system that can perform impedance analysis with very small inaccuracies from frequencies of 100 Hz through 8MHz.
Required System Components
PXI Instrumentation System | Custom Interface Circuitry |
|
|
Hardware Implementation and Theory
In order to determine the impedance of a measured component, voltages and currents throughout the frequency range of interest must be measured. Since our measurement system provides two, high-speed voltage input channels through our digitizer/oscilloscope, we must utilize an external interface circuit in order to allow us to make two voltage measurements, that in actuality represent voltage and current values from our device under test (DUT) that we can use to calculate the unknown impedance of the device. (External interface circuit schematic is attached as ‘PXI Interface Schematic’ as well as included below in Figure 1) A sine wave from the function generator is connected to an amplifier to be used as a voltage reference. The sine wave is also connected through the DUT to a second amplifier to give a measurement of the current through the DUT. Using these two voltage measurements the unknown impedance of the DUT can be calculated by the equation:
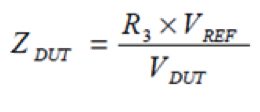
In the current design, optimal impedance measurements are made when the DUT impedance is close to the R3 resistor value giving results with less than 1% error. This circuit and software allows for cable compensation using an open, a short and a known resistor measurements to reduce or eliminate the test cable impedance from the DUT measurement. The location of R3 and its influence in this configuration is depicted in the circuit diagram below.
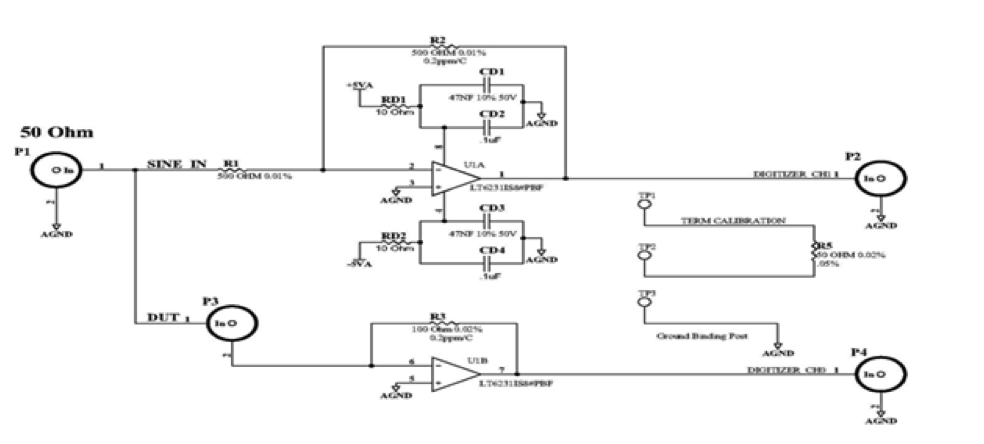
Figure 1: External PXI Interface Board Schematic
Software Implementation in LabVIEW & Calibration Theory
The source code of this specific application is provided with this article ‘As Is’, and are not supported for further modifications by National Instruments. In order to open and run this software, LabVIEW 2010 or newer is required and the NI-SCOPE, NI-FGEN, and NI-DCPOWER drivers are required along with the corresponding hardware devices.
The implementation includes a state machine architecture that allows for excitation to be provided to the active amplifier circuit (external interface circuit), the function generation to provide the swept stimulus signal, measurements to be made simultaneously on the digitizer, and analysis and calculations to be made of the measured data.
Previously to conducting an accurate measurement, an Open, Short, Reference/Load calibration is necessary to compensate for the cabling and internal system circuitry. Using available information regarding four-point network compensation throughout the paragraphs below, the equations and resultant calculations are implemented in the LabVIEW application.
The open/short compensation used in instrument models the residuals of a test fixture or test leads as a linear four-terminal network (a two-terminal pair network) represented by parameters
A, B, C, and D (shown in Figure B-1.) This circuit model is basically same as that used in open/short/load compensation.
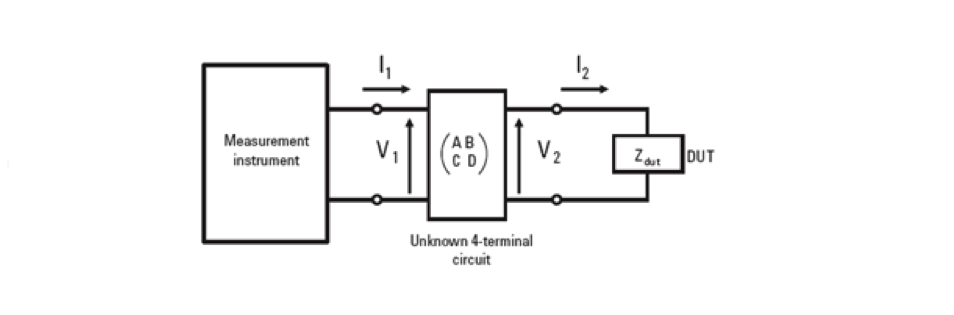
Figure 2: Four-terminal network circuit model of a test fixture or test cables
The difference between open/short and open/short/load compensation is that the open/short compensation assumes the unknown network as a “symmetrical network.” From this restriction, the open/short compensation does not require the load measurement. The circuit model shown in Figure 3 is expressed by using the following matrix equation:
| Equation 1 |
The relationships between V1, I1, V2, and I2 are given by the following equations:
| Equation 2 |
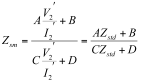
Therefore, the relationship between A and D parameters must be determined. The measurement of a reference DUT (load device) is required to determine A and D. When the applied voltage across a load device is V2’ and the current flow through it is I2’, the impedance of the load device, Zstd, is expressed as:
 | Equation 3 |
The measured value of the load device, Zsm, is expressed by using matrix parameters like Equation 4 of open/short compensation, as follows:
 | Equation 4 |
By substituting Zstd for V2’ / I2’ in Equation 4, the following equation is derived:
 | Equation 5 |
Using the equation for open measurement and the equation for short measurement, the relationship between the parameters A and D is expressed by the following equation:
 | Equation 6 |
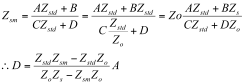
By substituting for the parameter D of Equation 6, the equation for calculating the corrected impedance of the DUT is derived as follows:
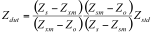 | Equation 7 |
Zdut Corrected impedance of the DUT |
Zxm Measured impedance of the DUT |
Zo Measured impedance when the measurement terminals are open |
Zs Measured impedance when the measurement terminals are short |
Zsm Measured impedance of the load device |
Zstd True value of the load device |
Note: These parameters are complex values which have real and imaginary components.
Performance Comparison
The HP 4194A is a discontinued instrument in industry that provides similar measurement performance and range of frequencies. When the above implementation was compared to the HP 4194A through several comparison measurements using known resistor and capacitor values, the results shown below in Figure 3 were obtained. This displays nearly identical measurements up to 8MHz and an overall acceptable performance.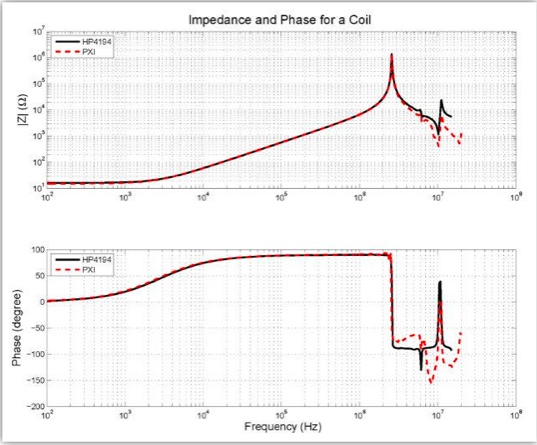 Figure 3: Performance Comparison of PXI Impedance Analyzer and HP 4194 Legacy Instrument
- Mark as Read
- Mark as New
- Bookmark
- Permalink
- Report to a Moderator
