Performance Monitor Using LabVIEW
- Subscribe to RSS Feed
- Mark as New
- Mark as Read
- Bookmark
- Subscribe
- Printer Friendly Page
- Report to a Moderator
Products and Environment
This section reflects the products and operating system used to create the example.To download NI software, including the products shown below, visit ni.com/downloads.
- LabVIEW
Software
Code and Documents
Attachment
Overview
This VI gets values from Windows performance counters for using in analyzing code performance
Description
The Performance Monitor VI is an example of how to get values from Windows performance counters for using in analyzing code performance. Accessing these built in performance counters can be done on computers running Windows with the .NET framework. The interface is similar to the Windows Performance Monitor (perfmon.exe) tool, but sampling rate changes are allowed.
Windows Performance Counters
Windows performance counters allow tracking of various system and application performance statistics. Common tracked values are the percent processor time being used; both total and for individual processes, cache flushes, number of threads, and so on. This type of tool is particularly useful when optimizing complex code or trying different program architectures. Analysis of multicore (dual—core and quad—core for example) systems running parallel programs is simplified with this type of performance tracking capability.
Performance Monitor VI Function
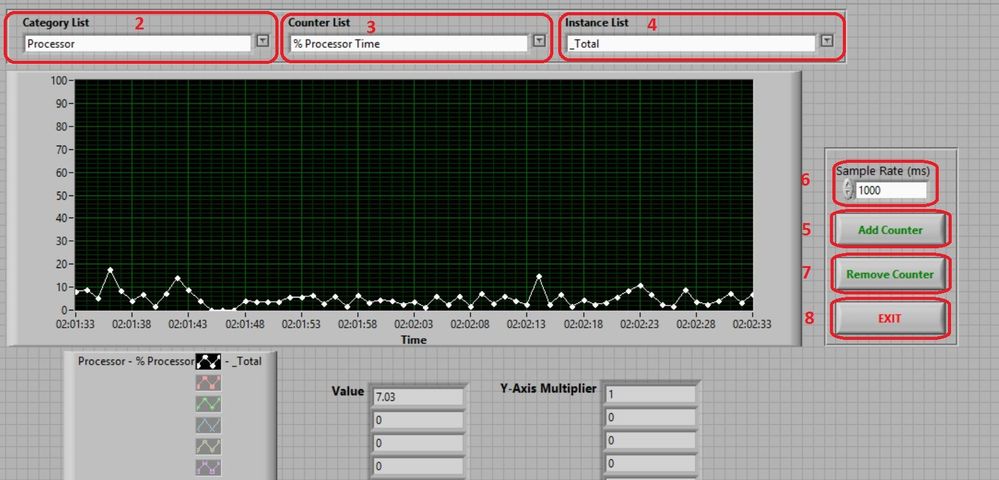
The function of the performance monitor requires the selection of a category from the category list first. Next the select a counter from the counter list (this will be the monitored value: %Processor Time, flushes/sec, and so on). Then the select an instance from the instance list if any items are available in the list. If no instances are available, this step can be skipped. To begin graphing the selected counter, click the Add Counter button, the counter’s description will be added to the plot legend in the lower left corner and graphing will begin. Up to 10 counters can be monitored at once. All counters are sampled at the same rate; this rate is controlled with the Sample Rate numeric control and is initialized to 1000ms. To remove a counter, select the counter you wish to remove using the category, counter and instance lists and click the remove counter button.
Requirements
LabVIEW 2012 or compatible
Steps to Implement or Execute Code
A commonly viewed performance statistic is the percent of the total processor time being used. This is a step by step example of viewing that value using the Performance Monitor VI. This example assumes the VI has already been downloaded and opened.
- Click the Run button while viewing the Performance Monitor VI front Panel.
- Once initialization is complete (should just take a few seconds, the lists and plot legend should be cleared) select the desired performance monitor category from the left most list on the top of the screen. In this case choose the Processor category.
- The arrow next to the counter list should now be black, select the desired counter. In this case select the %Processor Time counter in the center list.
- The arrow next to the instance list should now be black, select the desired instance. In this case select the _Total instance.
- Now click the Add Counter button to begin graphing the percent total processor time being used.
- To change the sample rate, modify the number in the Sample Rate control.
- To remove the counter, leave the selected values of Processor, %Processor Time, and _Total in the lists and click the Remove Counter button.
- To exit the program, click exit.
Figure 1. Monitoring Percent Processor Time
Additional Information or References
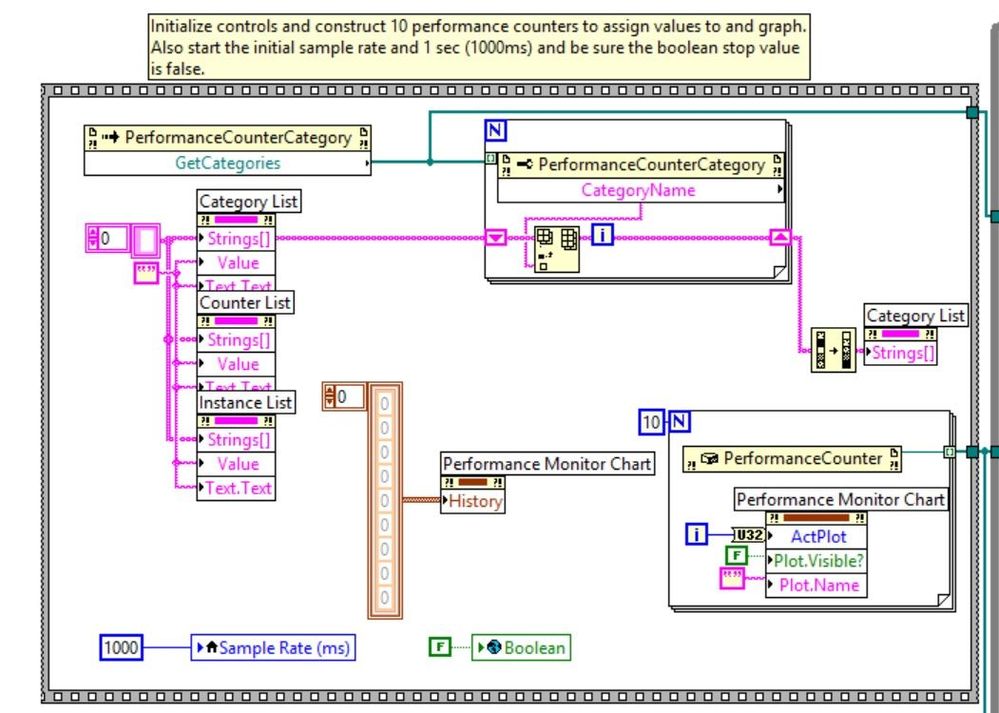
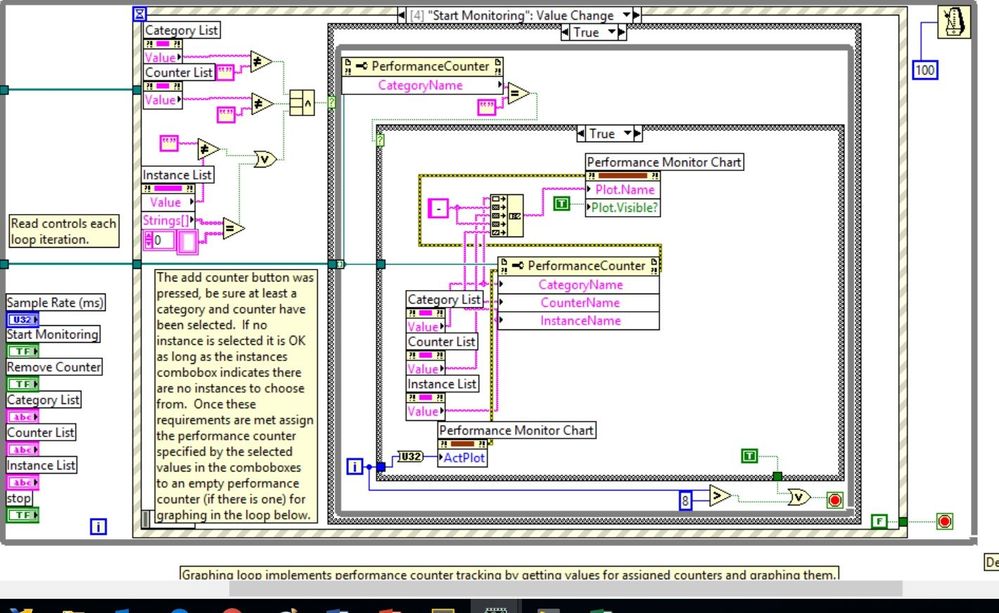
VI Block Diagram
**This document has been updated to meet the current required format for the NI Code Exchange. **
Example code from the Example Code Exchange in the NI Community is licensed with the MIT license.
- Mark as Read
- Mark as New
- Bookmark
- Permalink
- Report to a Moderator
Thank you for a very useful example!!


