Diagonal Intensity Profile with Sub-Pixel Accuracy and Diagonal Line Length
- Subscribe to RSS Feed
- Mark as New
- Mark as Read
- Bookmark
- Subscribe
- Printer Friendly Page
- Report to a Moderator
Code and Documents
Attachment
Description:
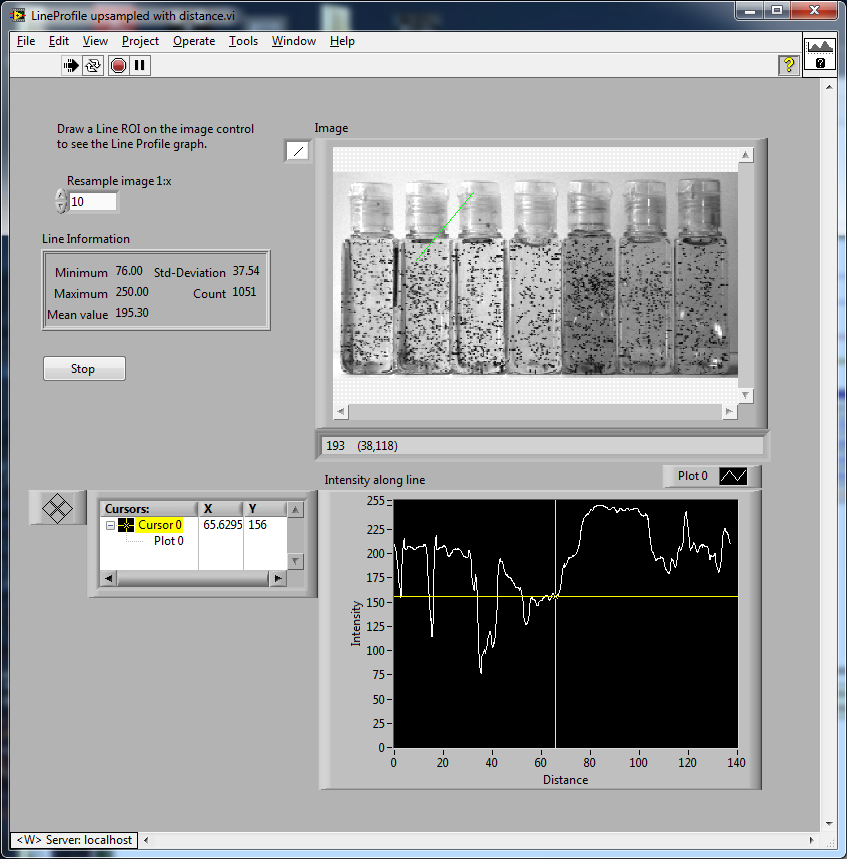
The VI demonstrates how to use IMAQ LineProfile with IMAQ Resample and IMAQ Point Distances to get a line intensity profile for diagonal lines. IMAQ LineProfile returns a pixel intensity profile as long as the X or Y length of the ROI line. This example VI upsamples the image, gets a pixel intensity array, and plots it as a function of distance (in pixel units) along the ROI line. This results in an intensity profile with sub-pixel accuracy along the true length of the diagonal ROI line.
Compare the results of this VI to the results of the shipping example "LineProfile Example.vi" which can be found in the Example Finder at the location Toolkits and Modules » Vision » Functions » LineProfile Example.vi.
For example, for an ROI line from (0,0) to (10,10), IMAQ LineProfile returns a line profile of length 11. This example VI (LineProfile upsampled with distance.vi) returns a line profile of length 14.142, which is the true length of the ROI line.
This VI was built using LabVIEW 2011 with Vision Development Module 2011.
Instructions:
1) Download the attached "LineProfile upsampled with distance.vi"
2) Run it
3) When prompted, select an image to analyze
4) Click and drag on the image to draw an ROI line
5) Use the cursor of the "Intensity along line" graph to inspect the line profile with sub-pixel accuracy
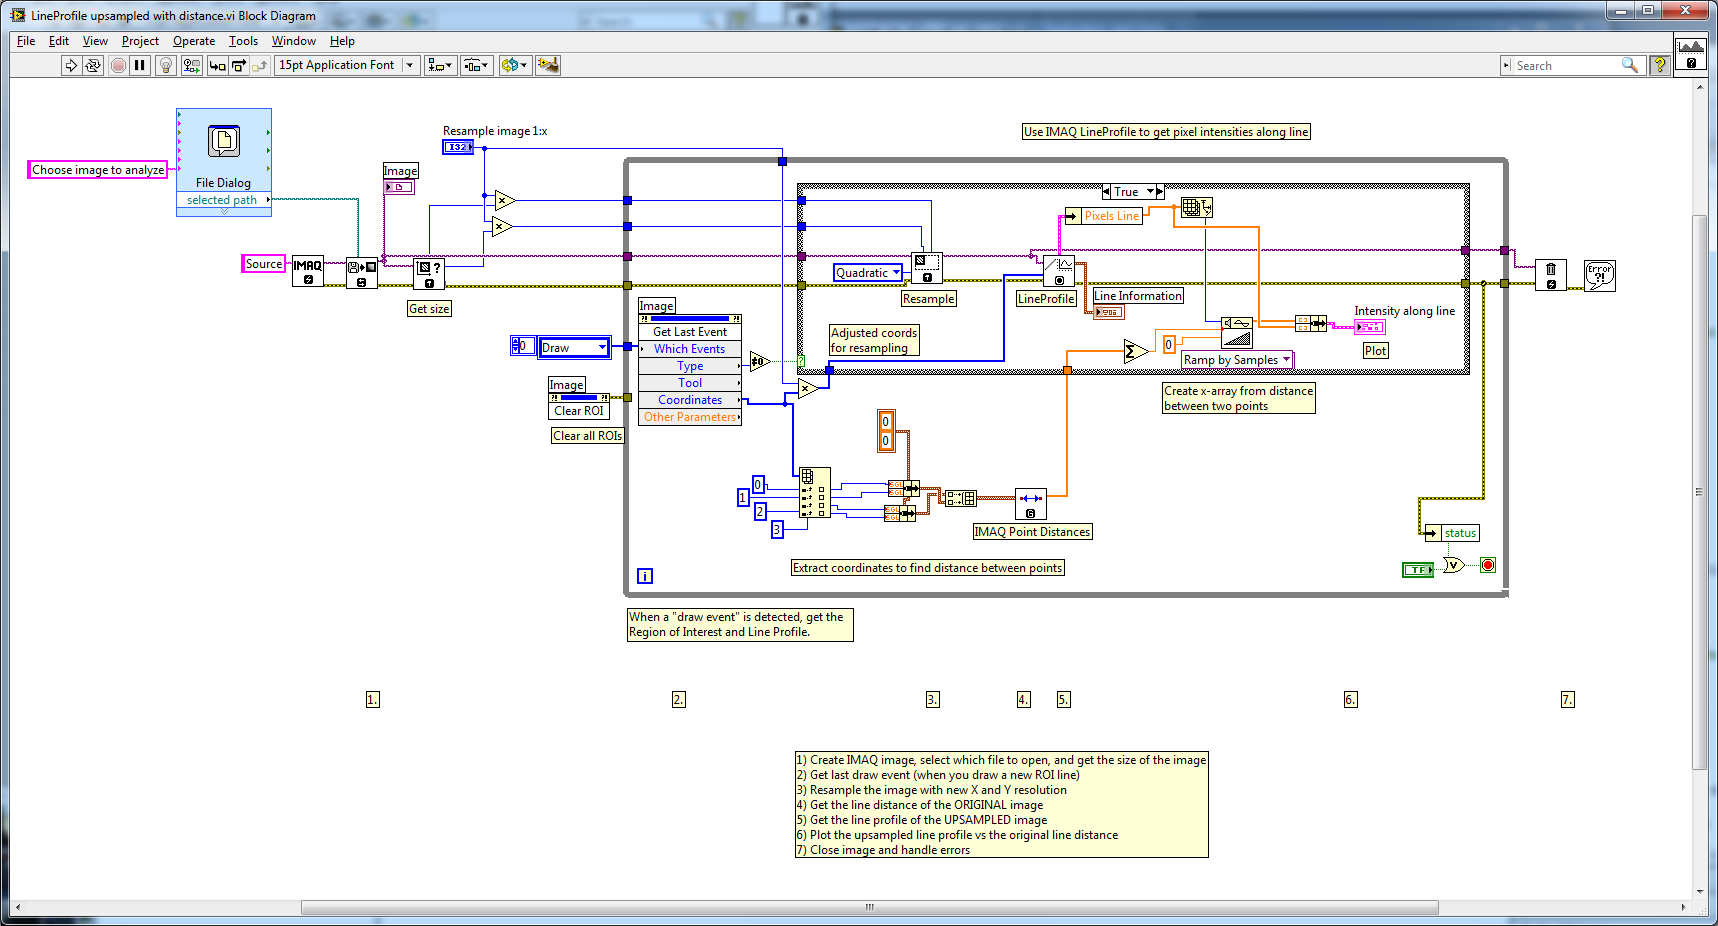
Block Diagram Steps:
1) Create IMAQ image, select which file to open, and get the size of the image
2) Get last draw event (when you draw a new ROI line)
3) Resample the image with new X and Y resolution
4) Get the line distance of the ORIGINAL image
5) Get the line profile of the UPSAMPLED image
6) Plot the upsampled line profile vs the original line distance
7) Close image and handle errors
Example code from the Example Code Exchange in the NI Community is licensed with the MIT license.
