- Document History
- Subscribe to RSS Feed
- Mark as New
- Mark as Read
- Bookmark
- Subscribe
- Printer Friendly Page
- Report to a Moderator
- Subscribe to RSS Feed
- Mark as New
- Mark as Read
- Bookmark
- Subscribe
- Printer Friendly Page
- Report to a Moderator
![]()
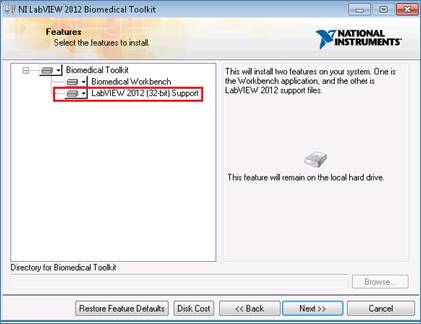
This document is to teach you how to write a simple 3D Image Reconstructor which reconstructs 3D models from 2D medical images by using Biomedical Toolkit VIs.
If you have installed Biomedical Toolkit LabVIEW 2012(32-bit) Support version, it is very easy to load 2D slices from BMP/JPEG/PNG/DICOM images and do 3D visualization in LabVIEW 2012.
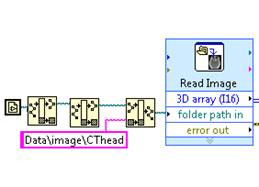
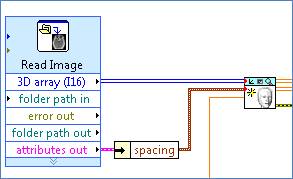
There are 4 main steps to write the 3D Image Reconstructor VI as the following block diagram shown:
Use Read Image Express VI to read images from files
Read Image Express VI is to load images from different file types, such as BMP, JPEG, PNG and DICOM.
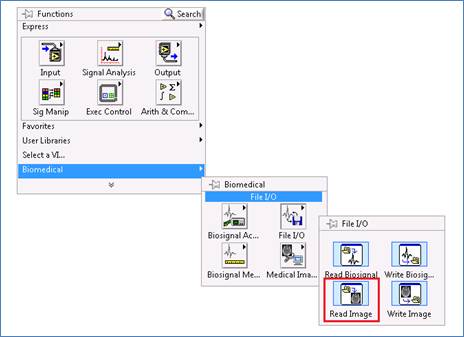
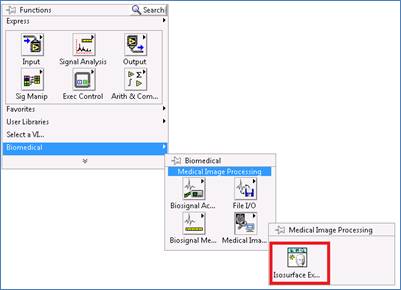
VI Location
You could find Read Image Express VI on the palette of Biomedical Toolkit to load images from different file types, such as BMP, JPEG, PNG and DICOM:
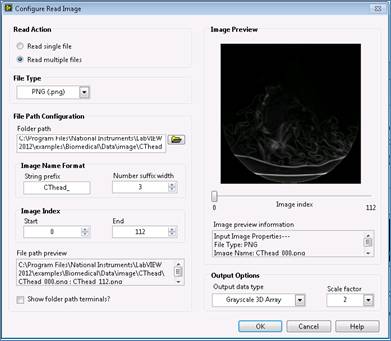
Configure Read Image
- In the Read Action section, select Read multiple files when you want to load an image series.
- In the File Type section, select the image type you want to load.
- In the File Path Configuration section, do the following steps. Firstly, click Browse button next to the Folder path to select a folder path that the image files locate. Secondly, configure the name of image series in the Image Name Format subsection and Image Index subsection. For example, if the name of image series is CThead_000, CThead_001, … , CThead_112, then String prefix is CThead_, Number suffix width is 3, Start is 0 and End is 112. You can preview the file path through the File path preview.
- Once you configure the file path correctly, you can preview the images in the Preview Image section. Drag the Image index slider to preview one of the images from Start to End.
- (Optional) If the size of your input image series is too larger, you can downsample them by selecting Scale factor.
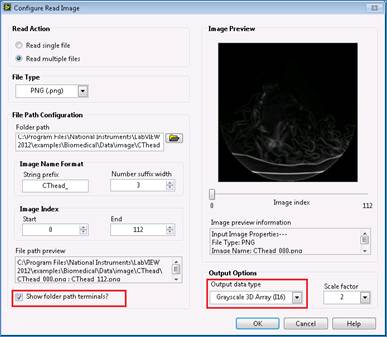
(Option) Advanced Configure Read Image
Check the Show folder path terminals?, then you can change the folder path programmatically instead of opening the Configure Read Image dialog to change the Folder path. But then you must decide the Output data type. If the image data type is U16 but you select U8, then the image data will be lost the high 8 bits.
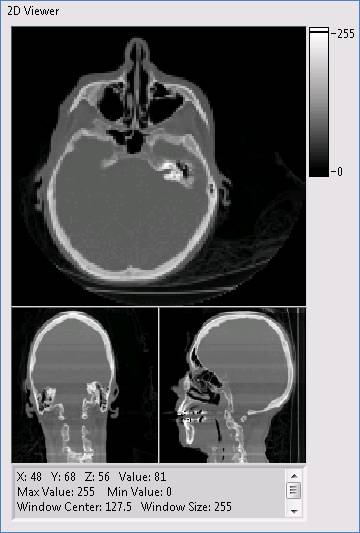
Use 2D Viewer Control to display the 2D slices
Displays the X-Y, X-Z and Y-Z plane that intersect the coordinates of 3D volume data. You can mouse down and drag on the 2D Viewer to see the three planes under different positions.
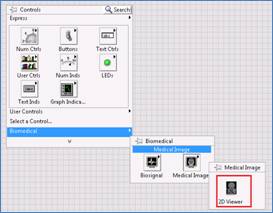
Control Location
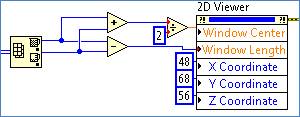
Set Properties
On the block diagram, right-click 2D Viewer and select “Create->Property (Invoke) Node”. Then you can set or get properties by using 2D Viewer Property nodes or invoke nodes. As the following snapshot shows, we can set the window center/length value and X/Y/Z coordinate by through their corresponding property nodes.
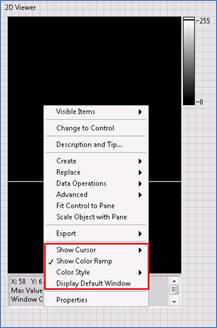
Short-cut Menu
Right-click 2D Viewer, you will find the Show Cursor, Show Color Ramp, Color Style and Display Default Window menu.
Show Cursor (Up/Low)
Displays the up or low cursor on the 2D Viewer. You also can use Up/Low Cursor Visible property to display the up or low cursor on the 2D Viewer programmatically.
Show Color Ramp
Displays the color ramp on the 2D Viewer. You also can use Ramp Visible property to display the ramp on the 2D Viewer programmatically.
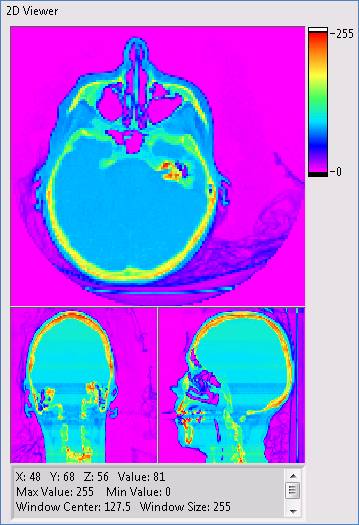
Color Style
Color style of the 2D Viewer. You can select the predefined color map including Shaded, Color Spectrum and Gray Scale.
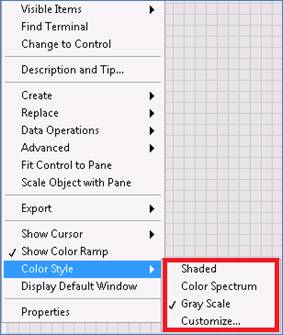
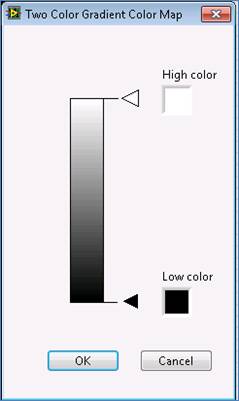
You also can customize color map. Select the High color and Low color.
Display Default Window
Display the images with the following window center/length value:
window center = (Max + Min)/2;
window length = Max-Min, Max specifies the maximum intensity value of the input 3D volume data while Min specified the minimum intensity value of the input 3D volume data.
You can also use Window Center/Length property to set the window center/length value programmatically.
Use the Isosurface Extractor VI to extract isosurface and isonormal from 2D slice.
VI Location
How to Use
After getting the 3D volume data by using Read Image Express VI, connect the 3D array output to the volume input terminal of Isosurface Extractor VI, which extracts the isosurface and isonormal from a 3D volume data set. Each page or slice of volume stores the volume data on a particular z-coordinate. On one page or one slice of volume, each row or column stores the volume data on a particular y- or x-coordinate. Spacing input terminal specifies the spacing between adjacent pixels or slices in x-, y- and z-axis, correspondingly. When you input DICOM image series and they have spacing properties, you can get the spacing attributes from Read Image Express VI and connect to the spacing input terminal of Isosurface Extractor VI.
Iso value specifies the volume level at which this VI generates the isosurface and isonormal. You should determine a suitable isovalue to generate the isosurface and isonormal.
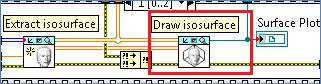
Use the Draw Isosurface VI to draw the isosurface and isonormal to the 3D picture control
VI Location
This VI is not located on the palette. You find it under the folder …\National Instruments\LabVIEW 2012\vi.lib\addons\Biomedical\Medical Image.
How to Use
Connect the isosurface and isonormal output terminals of Isosurface Extractor VI to isosurface and isonormal input terminals of Draw Isosurface VI. Finally, connect the isosurface refnum to the 3D Picture Control.
You can operate the 3D Picture Control as follows:
- Shift + left-click: Zoom in or zoom out
- Ctrl + left-click: Move
- Alt + left-click: Rotate
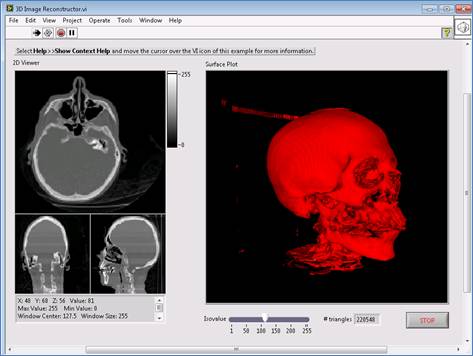
The following is the front panel of the example VI described in this document. If you have installed Biomedical Toolkit LabVIEW 2012(32-bit) Support version, you can find this example under the folder …\National Instruments\LabVIEW 2012\examples\Biomedical\Medical Image. And you can find the sample data used in this example under …\National Instruments\LabVIEW 2012\examples\Biomedical\Data\image\CThead.
Feel free to let us know your questions in using these VIs and Controls.
- Mark as Read
- Mark as New
- Bookmark
- Permalink
- Report to a Moderator
Hi Haier_Xu,
The Iso value specifies the volume level at which this VI generates the isosurface and isonormal.
Let say: For an 8-bit image the Isovalue was 100 for example. All pixels with a gray value greater than 100 will be reconstructed into a 3D image. Right?
For the medical field, it is interesting to reconstruct certain gray value ranges, for example the range between 50 and 150!
Is it possible to modify the "Isosurface Extractor VI".
I'm looking forward to hear from you. Thanks in advance
Peter
- Mark as Read
- Mark as New
- Bookmark
- Permalink
- Report to a Moderator
Hi PietH,
I think you can preprocess the image data. For example you can set piexls which have the values between 50 and 150 to 50.
- Mark as Read
- Mark as New
- Bookmark
- Permalink
- Report to a Moderator
Hi bo jiang
thats right. But every time when I like to change the range I must create a new Volume set. Changing isovalue is much faster I think.
I load a dataset of let say 50 lung ct images. Then i do preprocessing to extract only the lung from the Dicom CT-Image.
Now I reconstruct the whole lung with Isosurface Extractor VI. (Isovalue=10).
Then I like to call Isosurface Extractor VI again with different Isovalues Ranges to show overdistended,normal aerated or poor aerated parts of the lung.
- Mark as Read
- Mark as New
- Bookmark
- Permalink
- Report to a Moderator
Hi PietH,
I'm sorry you make a concept error. If isovalue is 100, the surface that equals to 100 will be extracted but not greater than 100. That's why we call it "iso-surface".
Now Isosurface Extractor VI doesn't support inputting isovalue range. The method you set the pixels between 50 and 150 to 50 or any constant will change the isonormal value which may affect the display effect. But I believe it's not a big problem.
You can also input several typical isovalues one by one to this VI and draw multiple isosurfaces at the same time. But it will degrade the performance(speed, memory usage).
Haier Xu
- Mark as Read
- Mark as New
- Bookmark
- Permalink
- Report to a Moderator
Hi Haier Xu,
I have two questions
1.) Is it possible to create a "Model render window" with BMT labVIEW VIs (like in the "3D Image Reconstructor Window" of the "Biomedical Workbench")?
2.) Question about the 3 D reconstruction algorithm of the BMT 3D Image Reconstructor!
I have a DICOM CT image serie with let say 300 axial (transverse) images (dimension: 512x512 pixel, slice thickness: 0,6 mm).
If I try to use the 3D Image Reconstructor from the BMT, it tooks a very long time to load the images and then it runs into an "not enough memory" error. So its not possible to reconstruct a 3D model from these images.
Last week I have tried an open source software for medical image reconstruction. The same 300 images were loaded very fast. Also the reconstruction of the 3D model and the presentation of the saggital and coronar views is very fast (some seconds) without any memory problems. The 3D model is really impressive and could also presented in different color palettes (like the palettes in Imaq-Vision).
There are several OpenSourceProjects active.
- MITO (Medical Imaging TOolkit): http://sourceforge.net/projects/mito/
- 3Dim Viever" http://www.3dim-laboratory.cz/software/3dimviewer/
- Invesalius: http://svn.softwarepublico.gov.br/trac/invesalius
- 3D Slicer: http://www.slicer.org/
All these Open Source packages uses different free 3rd party libraries (i.e. the DicomToolkit: http://dicom.offis.de/dcmtk.php.en; Open Mesh: http://www.openmesh.org/; OpenSceneGraph: http://www.openscenegraph.org/ and others ...)
Do you have an idea why this software could load and reconstruct 300 images so fast without any memory problems? Is there a possibility to use the these libraries in LabVIEW and/or BMT?
Thanks in advance
Pie
