Document Options
- Document History
- Subscribe to RSS Feed
- Mark as New
- Mark as Read
- Bookmark
- Subscribe
- Printer Friendly Page
- Report to a Moderator
Document options
- Subscribe to RSS Feed
- Mark as New
- Mark as Read
- Bookmark
- Subscribe
- Printer Friendly Page
- Report to a Moderator
![]()
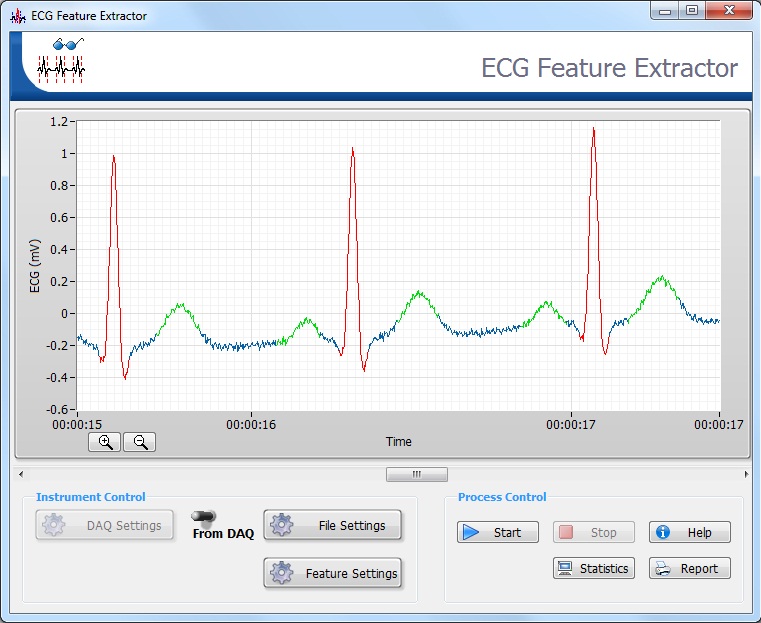
ECG Feature Extractor
An electrocardiogram (ECG) is a graph, produced by electrocardiographs, that provides information about individual cardiac health. An ECG records bioelectric currents generated by the heart. Clinicians can evaluate the conditions of a patient's heart from the ECG and perform further diagnosis by extracting features, such as the heart rate, amplitude, and so on.
The ECG Feature Extractor in Biomedical Workbench of LabVIEW Biomedical Toolkit is an application for extracting ECG features. This application includes the following features:
- Acquiring ECG signals from the ECG sensor.
- Importing ECG signals from various data sources, such as the MIT-BIH Database, a binary measurement file (.tdms), a text-based measurement file (.lvm), and MATLAB® .MAT.
- Preprocessing and extracting ECG features, such as the QRS complex, P wave, T wave, ST segment, and so on.
- Printing ECG Feature Extractor to report paper or Exporting report to HTML.
Acquiring ECG Signals
Complete the following steps to acquire ECG signals.
- Get the ECG sensor and other hardware ready. Launch the ECG Feature Extractor.
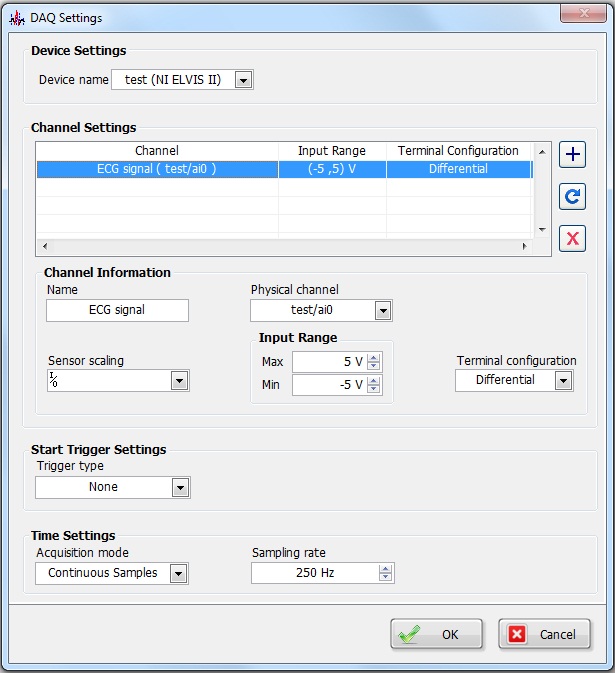
- Switch the Boolean to From DAQ and click on DAQ Settings, select the corresponding to hardware devices in the Device name drop-down menu.
- Select the ECG signal channel from the Physical channel drop-down menu and enter a name for the channel (eg: ECG signal). This is the channel from which the program will acquire data.
- Set the Max and Min Input Range as +5v and -5v.
- Set the Sampling rate as 250Hz.
- Leave other settings at their default values.
- Click the checkmark button in the right side of Channel Settings to add Channel AI0.
- Click the OK button.
- Click the Start button to begin acquiring the ECG signals.
Importing ECG Signals
Complete the following steps to import ECG signals.
- Launch the ECG Feature Extractor.
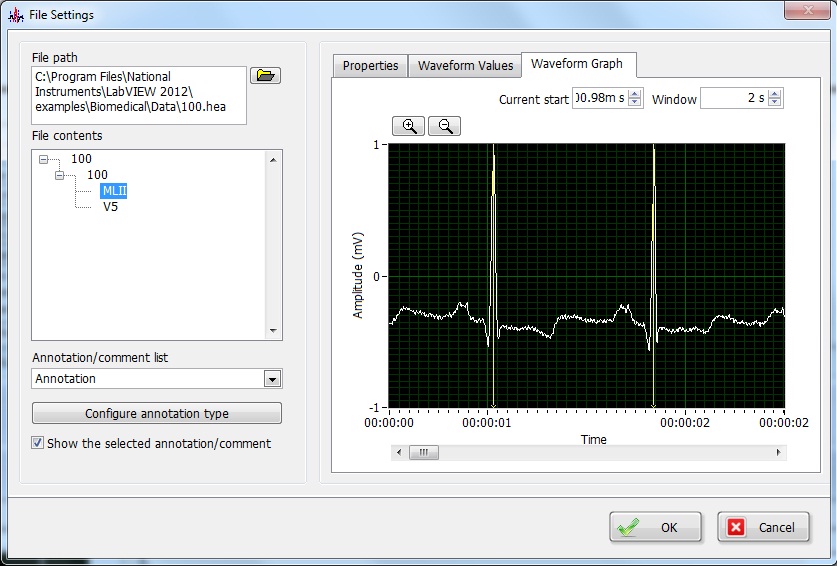
- Switch the Boolean to From File and click on File Settings. A pop-up window named File Settings should show up on your screen.
- Specifies the file path in the File path control to select the ECG data you want to import. The ECG Feature Extractor supports the following file types:
- TDMS (.tdms)
- LVM (.lvm)
- MATLAB® (.mat)
- PhysioBank Database (.hea)
- Axon Instruments data file formats (.abf)
- TDM (.tdm)
- Audio (.mp3, .wma, .wav)
- CSV (.csv)
- European Data Format (.edf, .rec)
- HL7_aECG (.hl7)
- SCP (.scp)
- ACQ (.acq)
- EMGWorks (.emg)
- AstroMed (.dcr)
- C3D (.c3d)
- DDF (.ddf)
- iWorx (.iwxdata)
- Select a channel in the File contents section that contains ECG signals.
- On the Properties page, observe the properties of the channel you selected.
- On the Waveform Graph page, observe the ECG signal. You can use the scroll bar, zoom in, and zoom out buttons to observe the signal.
- (Optional) For MIT-BIT database files, place a checkmark in the Show the selected annotation/comment checkbox to observe the annotation saved in the annotation file.
- Click the OK button to import the ECG signal and close the File Settings window.
- In the ECG Feature Extractor dialog box, observe the signal by using the scroll bar, zoom in, and zoom out buttons.
- Right-click anywhere in the Waveform display and select from the following options to set the range of the ECG signal to extract features.
- set start—Sets the start time of the signal.
- set end—Sets the end time of the signal.
- select all—Selects the entire time of the signal.
Preprocessing ECG Signal
Complete the following steps to preprocess the ECG signal you acquired or imported.
- Switch the Boolean to From File and click on Feature Settings. A pop-up window named Feature Settings should show up on your screen.
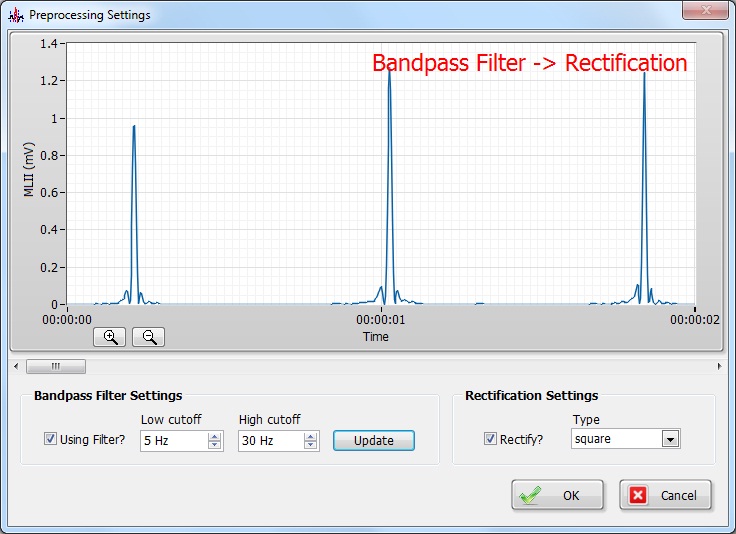
- Press the Preprocessing settings button. A pop-up window named Preprocessing Settings should show up on your screen.You can perform the following preprocessing functions:
- Bandpass filter
- Rectification
- Place a checkmark in the Using Filter? checkbox in the Bandpass Filter Settings section to include bandpass filter in the preprocessing phase.
- If the bandpass filter is not suitable, specify the Low Cutoff and High Cutoff of the bandpass filter.
- Click the Update button to redesign the bandpass filter by using the low cutoff and high cutoff values you specified in the previous step.
- Place a checkmark in the Rectify? checkbox in the Rectification Settings section to include rectification in the preprocessing phase.
- If the rectification is not suitable, you can specify the rectification type in the Type control.
- Observe the preprocessed ECG signal by using the scroll bar, zoom in, and zoom out buttons.
- Click the OK button to apply the preprocessing settings and to close the Preprocessing Settings configuration window.
Extracting ECG Signal Features
Complete the following steps to extract the features from ECG signals.
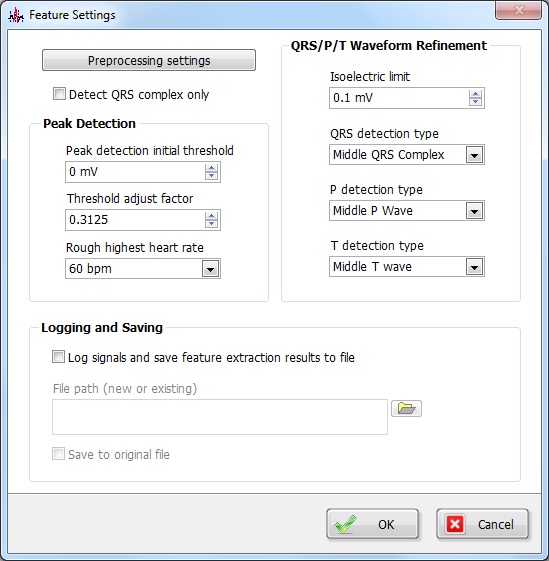
- Switch the Boolean to From File and click on Feature Settings. A pop-up window named Feature Settings should show up on your screen.
- If you want to extract the features of QRS complex only, place a checkmark in the Detect QRS complex only checkbox. If you want to extract all the features (including P wave, QRS complex and T wave), remove the checkmark.
- You can log and save the ECG signals with the extracted feature by placing a checkmark in the Log Signals and save feature extraction results to file checkbox. Specify the file path in the File path (new or existing) control.
- Set the Peak Detection parameters in the Feature Settings window. You can set the following controls:
- Peak detection initial threshold—Specifies the amplitude threshold of QRS Complex which is used in detecting R wave peaks.
- Threshold adjust Factor—Specifies the auto adjust factor in the auto threshold process when detecting R wave peaks. The larger the factor is, the fewer the R wave peaks will be find.
- Rough highest heart rate—Specifies the rough highest heart rate.
- Set the QRS/P/T Waveform Refinement parameters in the Feature Settings window. You can set the following controls:
- Isoelectric limit—Specifies the isoelectric level of the ECG signal.
- QRS detection type—Specifies the type of the QRS complex waveform (Narrow, Middle or Wide).
- P detection type—Specifies the type of the P waveform (Narrow, Middle or Wide).
- T detection type—Specifies the type of the T waveform (Narrow, Middle or Wide).
- Click the OK button to apply the feature settings and to close the Feature Settings configuration window.
- Click the Start button to begin extracting features of the signal.
- (Optional) If the signal you are extracting features from is long, the feature extraction process will be time consuming. You can click the Stop button to end the feature extraction process.
- Observe the signal with the extracted features in the window.
- Click the Statistics button to display the Heart Rate Histogram window. The Heart Rate Histogram window displays information about features extracted from the ECG signal, such as the mean value and standard deviation of the heart rate, QRS width, PR interval, QT interval, and QRS amplitude of the ECG data.
- Right-click a heart beat in the Waveform display and select Show Beat Characteristics to display the Beat Characteristics dialog box. The Beat Characteristics window displays information about the heart beat at the instance you right-clicked. Observe information about the heart beat, such as the RR interval, QRS amplitude, and so on.
Printing ECG Feature Extractor to report paper or Exporting report to HTML
Complete the following steps to print the ECG Feature Extractor report.
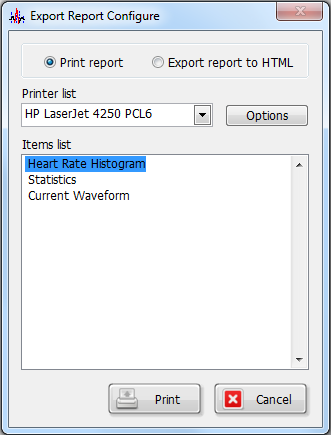
- Click the Report button in the lower right corner of the ECG Feature Extractor window. A pop-up window named Export Report Configure would display on your screen.
- Select the Print report menu.
- Select the corresponding printer from the Printer List drop-down menu.
- Click the Option button. A pop-up window named Report Options would display on your screen. You can set the parameters of Font and Page in this window.
- Click the OK button to return to the Exprot Report Configure window.
- Select the ECG features you want to export from the Item list which contains three components: Heart Rate Histogram, Statistics and Current Waveform.
- Click the Print button to export the ECG Feature Reports.
Complete the following steps to export the ECG Feature Extractor report to HTML
- Click the Report button in the lower right corner of the ECG Feature Extractor window. A pop-up window named Export Report Configure would display on your screen.
- Select the Export report to HTML menu.
- Specify the file path you want to save the HTML file in the File path menu.
- Click the Option button. A pop-up window named Report Options would display on your screen. You can set the parameters of Font and Page in this window.
- Click the OK button to return to the Exprot Report Configure window.
- Select the ECG features you want to export from the Item list which contains three components: Heart Rate Histogram, Statistics and Current Waveform.
- Click the Print button to export the ECG Feature Reports to HTML


Use the Heart Rate Variability (HRV) Analyzer to analyze heart rate variability.
Labels:
