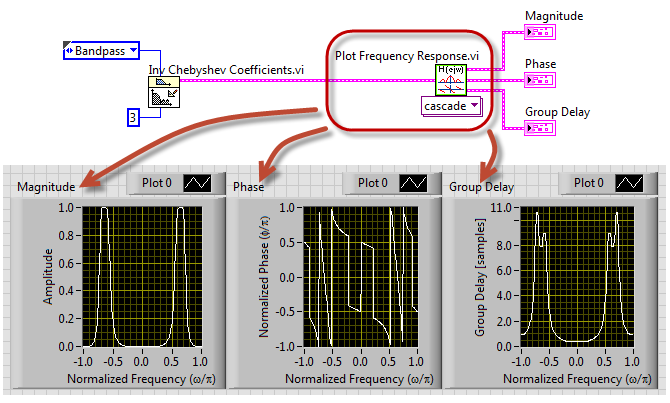
Summary: The "Plot Frequency Response" subVI accepts filter coefficients either in direct form -- a (reverse) and b (forward) coefficients -- or in cascade form produced by the LabVIEW filter coefficient calculator subVIs and produces the frequency response magnitude and phase plots as well as the group delay plot. Magnitude can be plotted in either linear or dB scale and phase can be plotted as either wrapped or unwrapped.
This subVI is based on the original "freqz.vi" frequency response plotter developed by Mark Yoder for the DSP First LabVIEW library.
Details: See the video for a complete demonstration:
Example code from the Example Code Exchange in the NI Community is licensed with the MIT license.