From 04:00 PM CDT – 08:00 PM CDT (09:00 PM UTC – 01:00 AM UTC) Tuesday, April 16, ni.com will undergo system upgrades that may result in temporary service interruption.
We appreciate your patience as we improve our online experience.
From 04:00 PM CDT – 08:00 PM CDT (09:00 PM UTC – 01:00 AM UTC) Tuesday, April 16, ni.com will undergo system upgrades that may result in temporary service interruption.
We appreciate your patience as we improve our online experience.
To download NI software, including the products shown below, visit ni.com/downloads.
Overview
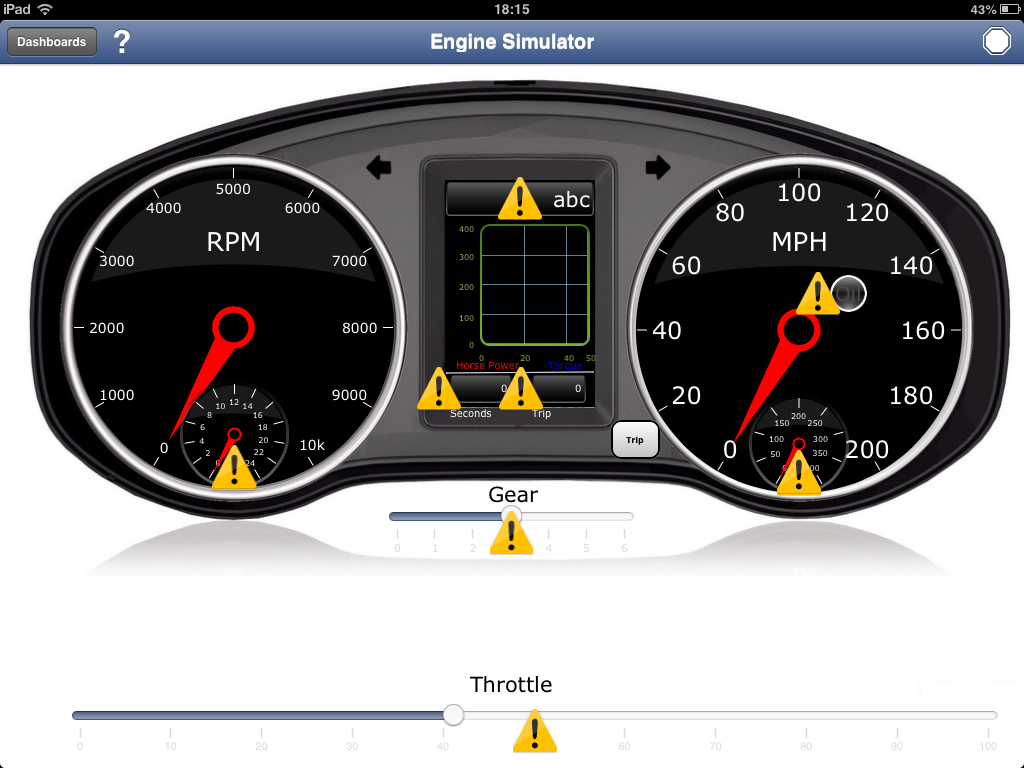
This example is an Engine Simulator that uses a combination of Shared Variables and Web services to display data on the dashboard.
Description
Inputs on the Data Dashboard are Throttle, Gear and Trip reset which, can be used to control the engine and trip counter respectively. The rest of the dashboard is made up of gauge, numeric and string indicators which are used to display the various engine variables. By manipulating the throttle and gear inputs you will see the engine's RPM and MPH change as well as the the turbo psi and engine oil temp rise. The display in the center displays time, current gear, engine horse power and torque (on overlapped graphs), engine running time in seconds and a trip time in seconds that can be rest. If the engine is left at maximum throttle for too long the oil temperature will rise and trigger the oil warning light.
Requirements
Steps to Implement or Execute Code
PC Steps:
iPad Steps:
There are two ways you can setup the dashboard in this example, the first is to use the Data Dashboard Retargeter Application and the second is described below.
**This document has been updated to meet the current required format for the NI Code Exchange.**
Example code from the Example Code Exchange in the NI Community is licensed with the MIT license.
Hello Mr.Maltmann
I'm relatively new for data dashboard user. I read of your document ,Downloaded your example and followed step-by-step i have problem that Engine sim project havn't had build function when I want to Deploy the stats Web service by right-click on stats and selecting Build. I have wonder that stats Web service that you meant is Reset_Trip.VI isn't it? So i built the webservice select stats.vi and built and deployed , i just wonder that what 's .VI that you choose on PC to build and deploy?,what's source file that you choose? and what's URL mapping that you use?
this is my setting

so my result is Dashboard of my Ipad cannot connect to webservice like this image as below
what should I do? Please give me an advice
Mimi
Hi Mini,
The web service is comprised of three VIs.
The first, Test Panel which runs as an Auxiliary VI that runs at start up. The second, stats.vi is a web methods that displays data on the graphs and the third, rest_trip.vi is used to reset the trip counter.
the URL mappings are /stats and /Reset_Trip
From the iPad screenshot it looks as though your shared variables are not working and that the web service it working correctly. You may want to try moving the gear or throttle slider to write to a variable and see it that makes you successful. Check to see if the Engine Variables library is deployed. You may want to create a test dashboard and try to connect to the variable library from that.
Mike
