Overview
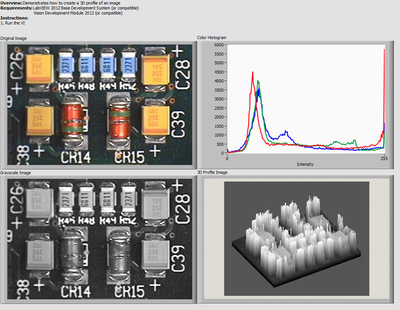
The example demonstrates how to create a 3D profile of an image.
Description
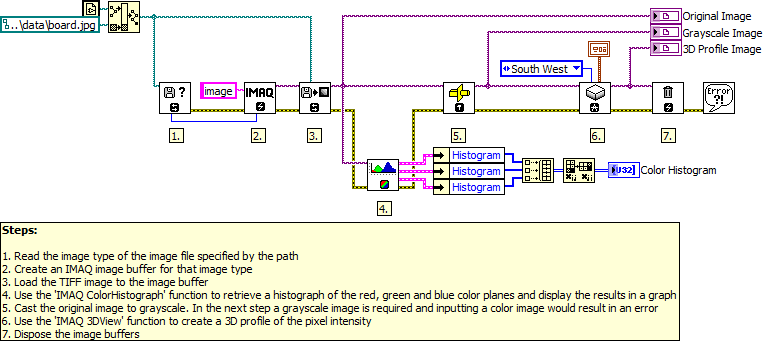
The 'IMAQ 3DView' function creates a 3D impression of the image intensity. Therefore a grayscale image is required.
To analyse the distribution of the color components red, green and blue, the function 'IMAQ ColorHistograph' is used to generate histrographs.
Requirements
Software
- LabVIEW 2012 Base Development System (or compatible)
- Vision Development Module 2012 (or compatible)
Hardware
- No hardware is necessary to use this example VI
Steps to Implement or Execute Code
- Run the VI
Additional Information or References


**The code for this example has been edited to meet the new Community Example Style Guidelines. The edited copy is marked with the text 'NIVerified'. Read here for more information about the new Example Guidelines and Community Platform.**
Daniel G.
Semiconductor & Wireless
National Instruments