From Friday, April 19th (11:00 PM CDT) through Saturday, April 20th (2:00 PM CDT), 2024, ni.com will undergo system upgrades that may result in temporary service interruption.

We appreciate your patience as we improve our online experience.

Example Code

LabVIEW Box Plots

Code and Documents

Attachment

The LabVIEW Code attached provides support for creating box plots and having multiple box plots presented on a single graph.

This code started with and improved code from these two examples:

-https://decibel.ni.com/content/docs/DOC-4929

-http://www.ni.com/white-paper/3047/en
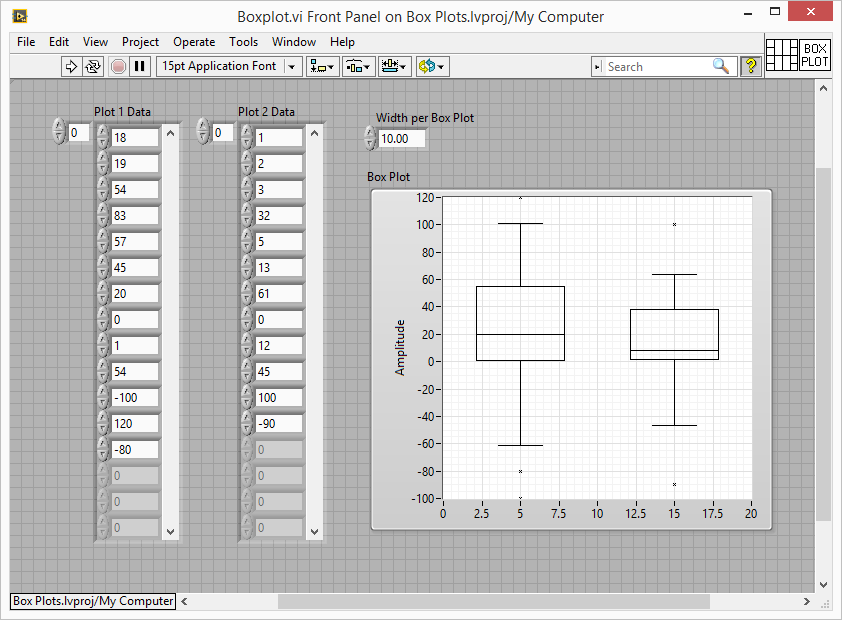
Front Panel:

Box Plot Front Panel.png

Block Diagram:

Box Plot Code.png

Improvements from the previous verisons:

-Improved quartile calculation: https://decibel.ni.com/content/docs/DOC-42015

-Made multiple box plot graphs work properly

-Added ability to change horizontal scale of plots (width per box)

-Added ability to choose plot color (instead of just black)

-Allows differently sized data arrays for each plot (by using an array of clusters)

Attached versions are in LabVIEW 2014, 2009 and 8.0 (using save for previous)

Craig H. | CLA CTA CLED | Applications Engineer | NI Employee 2012-2023

Example code from the Example Code Exchange in the NI Community is licensed with the MIT license.

Comments
gnunesjr
Member
Member
on

Thank you!  Extremely nice.  Works perfectly right out of the box, and is easy to use.

Just_Amber
Member
Member
on

This is amazing. Thank you for creating it.


sjtuyans
Member
Member
on

Thank you Craig, very easy to use and nice tool.

Shu Yan
CLA since 2010 | CTA since 2012 | CLED since 2016
sjtuyan@gmail.com
-Newton-
Member
Member
on

Still working beautifully in 2022! Thanks for creating this!

Contributors