- Document History
- Subscribe to RSS Feed
- Mark as New
- Mark as Read
- Bookmark
- Subscribe
- Printer Friendly Page
- Report to a Moderator
- Subscribe to RSS Feed
- Mark as New
- Mark as Read
- Bookmark
- Subscribe
- Printer Friendly Page
- Report to a Moderator
Contact Information
University: Silesian University of Technology
Project Leader: Dawid Wylenżek
Team Leader (control and software): Piotr Mierzwa
Team Leader (mechanics): Jakub Franiasz
Team Members (with year of graduation): Maja Baier, Tymoteusz Długosz, Piotr Domagała, Mateusz Dziewior, Aleksandra Dziwoki, Piotr Glowienka, Tomasz Grabka, Dominik Krakowczyk, Daria Macha, Beniamin Macura, Maciej Maślankiewicz, Mateusz Nowak, Michał Rutkowski, Karolina Rzepiela, Anna Samol, Patryk Smuda, Krzysztof Sosnowski, Łukasz Stebel, Łukasz Szwala, Tomasz Trajdos, Witold Wośkowiak, Michał Żuk
Faculty Advisers: Andrzej Baier, Marian Błachuta, Michał Majzner, Roman Wyżgolik, Michał Sobek, Łukasz Grabowski
Email Address: sg.polsl@gmail.com
Website: www.sg.polsl.pl
Fanpage: www.facebook.pl/silesiangreenpower
Submission Language: English
Project Information
Title: Optimization of electrical energy consumption rate using NI products – Silesian Greenpower

Picture 1 Team after the international finals, 2014
Description:
The goal of our project was to optimize the energy consumption of a light electric racing car. Using an on-board measurement system and research stations programmed in LabVIEW and equipped in NI hardware, we perform further simulation, test advanced technologies and suggest modifications leading to an optimization in energy usage.
Products:
National Instruments
- NI LabVIEW 2014 Development Suite, NI MAX, NI Diadem 2013
- LabVIEW Real-Time Module
- LabVIEW Control Design and Simulation Module
- LabVIEW FPGA Module
- NI-DAQmx
- myRIO 1900 (x2)
- sbRIO 9636 (x3)
- cRIO 9012 (engine test bench station)
- cDAQ 9174 (battery discharger)
- NI 9149 8 Slot Ethernet RIO (x2)
- NI 9211 (x2)
- NI 9205 (x1)
- NI 9215 (x3)
- NI 9403 (x2)
- NI 9263 (x2)
- NI 9870 (x1)
Other
- GEMAC PR-23024-30 2-dimensional Inclination Sensors with CAN Bus Interface
- Kelly Controls KDS24100E motor controller
- LEM HTFS 200 Current Transducer, LEM HASS 50-S Current Transducer
- OMRON EE-SX670 Slot-type Photomicrosensor
- UNI-T UT60E Multimeter (x2)
- DS18B20 Digital Thermometer
- GPS: Venus638FLPx
- NCTE 2.5 Nm Keyed Shaft to Shaft Non-Contact Rotory Torque Sensor
- NCTE 75 Nm Keyed Shaft to Shaft Non-Contact Rotory Torque Sensor
- Router Westermo MRD-330 (x2)
- J-type thermocouples
- Flir E6 thermal camera
The Challenge:
The world of motorsports constantly strives to overcome consecutive time limits. Technological innovations, transmission, engine add-ons or enriched fuel can significantly improve the performance of combustion in cars, but when it comes to an electric vehicle, we need to look for advantages elsewhere. This problem is well-known to teams participating in Greenpower race series organized in Great Britain. Fundamental premise of Greenpower races are its equal opportunities: all participants are obliged to use the same engine and batteries. Improvements of the performance should be sought in aerodynamics, reduced mass of the vehicle and driving strategies. Modifications to either the vehicle or the driving style must be based on the conclusions made on the previous laps and the analysis of the applied solutions. To make such conclusions, we must have an appropriate research stations that will provide us with needed measurement data.
The Solution:
Detailed examination of the vehicle and the advanced simulation allows for quick assessment of the solutions and the settings. The project is divided into two main parts: vehicle part and supporting part, the second one consisting on all equipment used for research, experiment and diagnosis of the car. Tests include simulating a real drive to the elements of the car on special test stands.
The vehicle
The drive system consists of a single DC motor controlled by DC Kelly Controls KDS24100E motor controller. The car is equipped with a single DC motor (240W 24V, up to 13 Nm) powered by a pair of lead-acid batteries connected in series. The motor and batteries are the only tightening regulations on elements used. Terms of racing also defines some elements of the vehicle structure, in particular the ones concerning the safety of the driver and the maximum dimensions of the car. Other elements depend only on the imagination of designers.
All our vehicles have been designed in Siemens NX. Picture 2 presents the model:
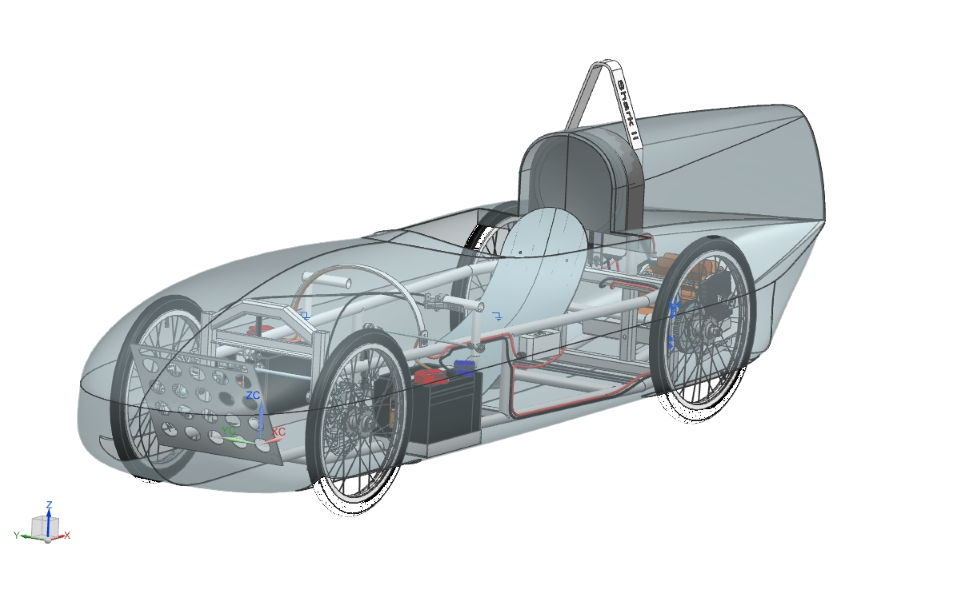
Picture 2: Visualisation of the NX model of the car
In addition to the mechanical design and the necessary electronics, the Silesian Greenpower vehicle has a built-in measuring system with a wide range of sensors:
- OMRON EE-SX670 Encoder
- J-type thermocouples
- LEM HTFS 200
- Pololu 1269 AltIMU-10
- Gemac Inclinometer
Measuring system provides information about the car including:
- Car velocity
- RPM of the motor shaft
- Current drawn from the battery
- Battery voltage
- Motor voltage
- Motor temperature
- Vehicle slope in 2 axes
- Vehicle acceleration in 3 axes
- Vehicle’s position on the raceway
- State of the gas button
- Brake usage
The data collected by the measurement system are then used for later analysis and identifying mistakes made by the driver and all symptoms of vehicle’s damage. Advanced data processing connected to the position on the track and trajectory allows you to find the factors consuming the most energy and determine the direction of their improvement. Accurate data from trainings and races allow us to compare different vehicle settings.
Onboard software, hardware and communications
Data from the onboard sensors connected to the measuring system are collected by the applications working on sbRIO 9636 FPGA. It is very convenient approach because even at this level the variety of sensors’ interfaces is significantly reduced. Synchronously collected data are sent to real-time applications operating at sbRIO.
Real-time application working on vehicle’s sbRIO accepts data from the FPGA and sensors connected to the CAN bus and RS232 bus. The measurement data are then transmitted to the data processing thread and then to the thread handling the data logging. This application is written in multithreaded object architecture allowing the appropriate data flow. All threads accept commands so we can control the application's behaviour.
All measured data are stored in the memory of the measuring system, but some data providing information about the car condition need to be transferred to for the pit-stop team in real-time.
Devices and cars used in our project are connected into network. Communication with the cars is realized through the Westermo MRD-330 GSM modules installed on each of the cars and the pit-stop station. This is a convenient form of communication due to the dependability, virtually unlimited coverage and simplicity of setup. The disadvantage of this method is the need to run a server application that collects data from all the cars and sends them to the pit-stop for visualization and vice versa – application analyzes commands from the pit-stop and sends them to the cars.
Transmitted data include:
- GPS position on the raceway
- Motor voltage
- Current drawn from the battery
- Motor temperature
- Car velocity
With this data, the pit-stop team can inform the driver of the current situation and make recommendations concerning driving techniques. These data also allow us to detect possible malfunction of the car.
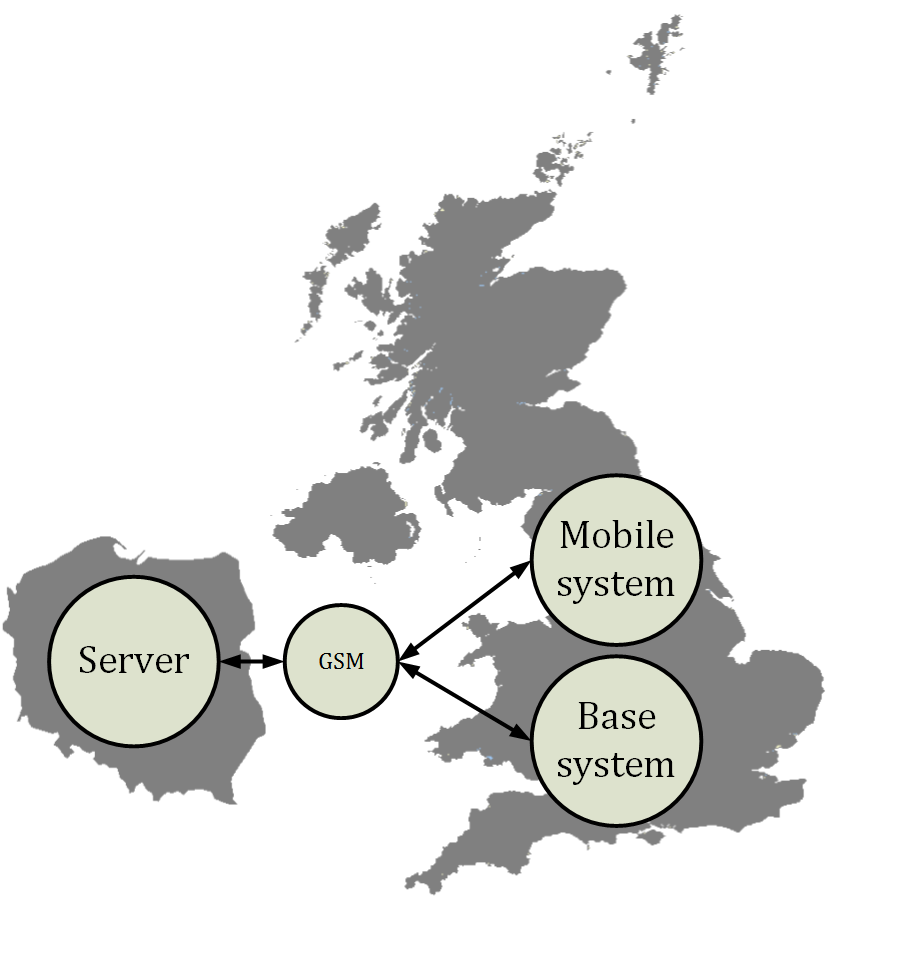
Picture 3: Communication
The basis of the measurement system of the car is sbRIO9636 shown in picture 4. The unit is connected to a set of sensors. Signal acquisition is realized on FPGA level. Due to the lack of direct connection of sensors to sbRIO, we have designed and manufactured a special terminal board showed in picture 5.
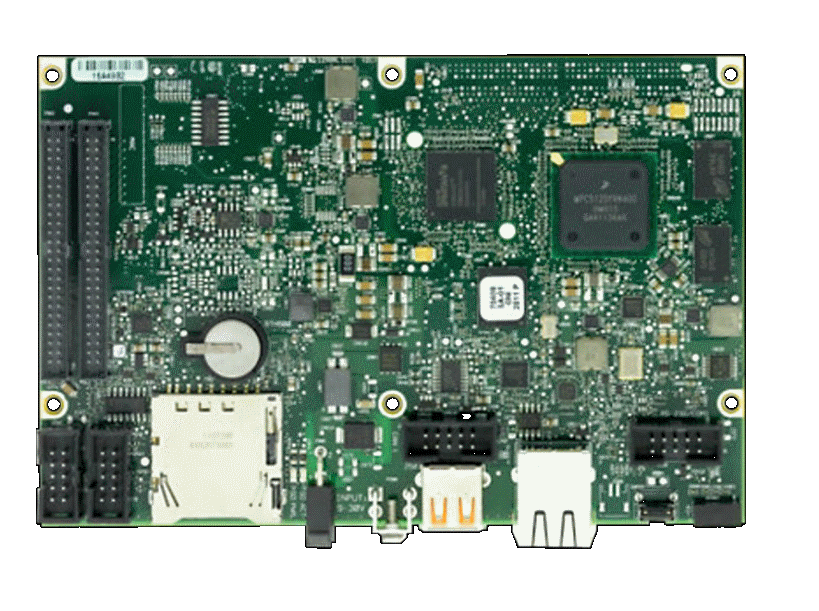
Picture 4: sbRIO9636
Picture 5: Connector terminal
Design and construction of the measurement system must take account of the conditions under which it operates. Working conditions in the car are difficult because the measurement system is exposed to flooding, high vibration and high temperature. In addition, it must draw as little energy as possible. SbRIO with all possible sensors was closed in airtight casing (pictures 6 and 7), connections to peripherals have been led by a waterproof M12 joints. Using this type of construction also allows for easy removal of the box, that lightens the car by approx. 2kg (4.41 lb).
Picture 6: Casing of the measurement system (closed) in chassis

Picture 7: Casing of the measurement system (open) in chassis
Manufacturing of a prototype of a measurement system made it possible to clarify the requirements and design a smaller version of the terminal block, which contains the additional sensors and reduces the amount of wiring needed. The project of the system can be seen in picture 8.
Picture 8: The measuring system
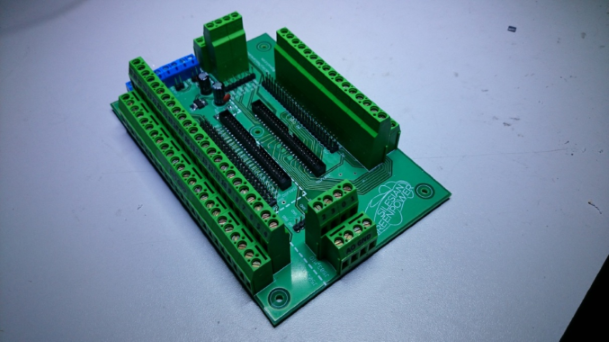
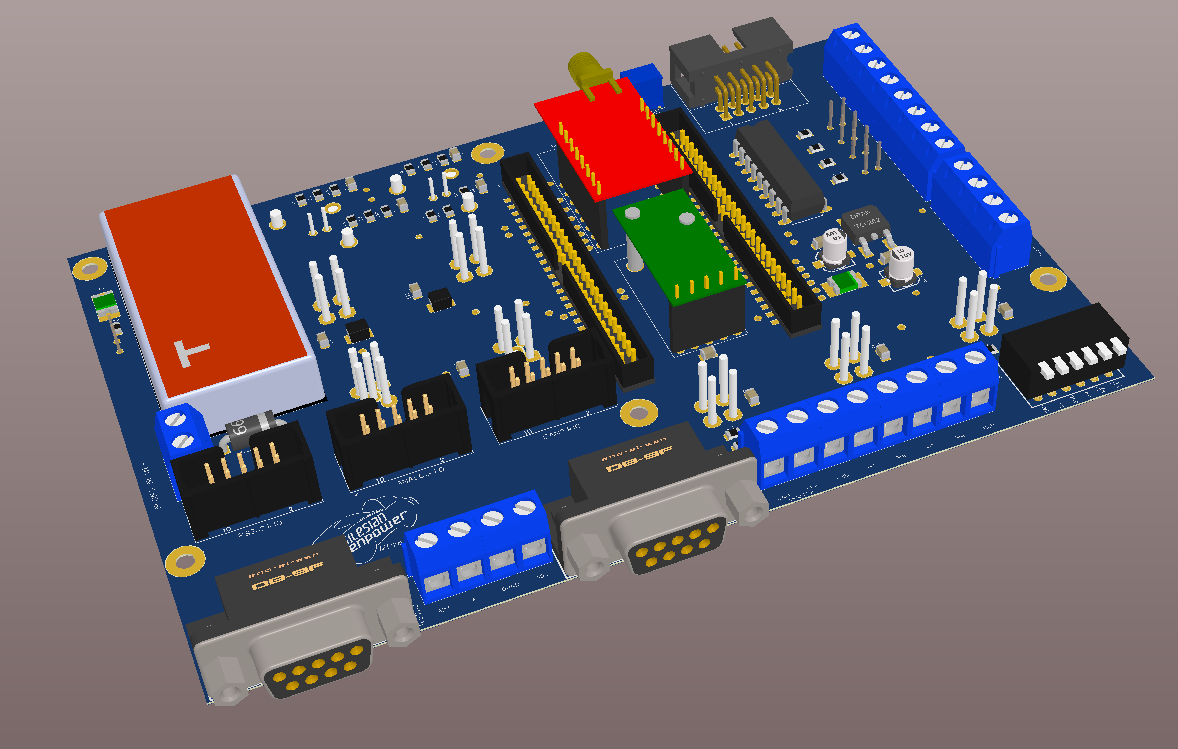
Designing the terminal in SMD technology allowed it to fit the dimensions of the terminal to sbRIO so that the entire measurement system has become more compact. On picture 9, we can see visualization of our system connected to sbRIO connector board. Picture 10 presents the photo of the connector board:
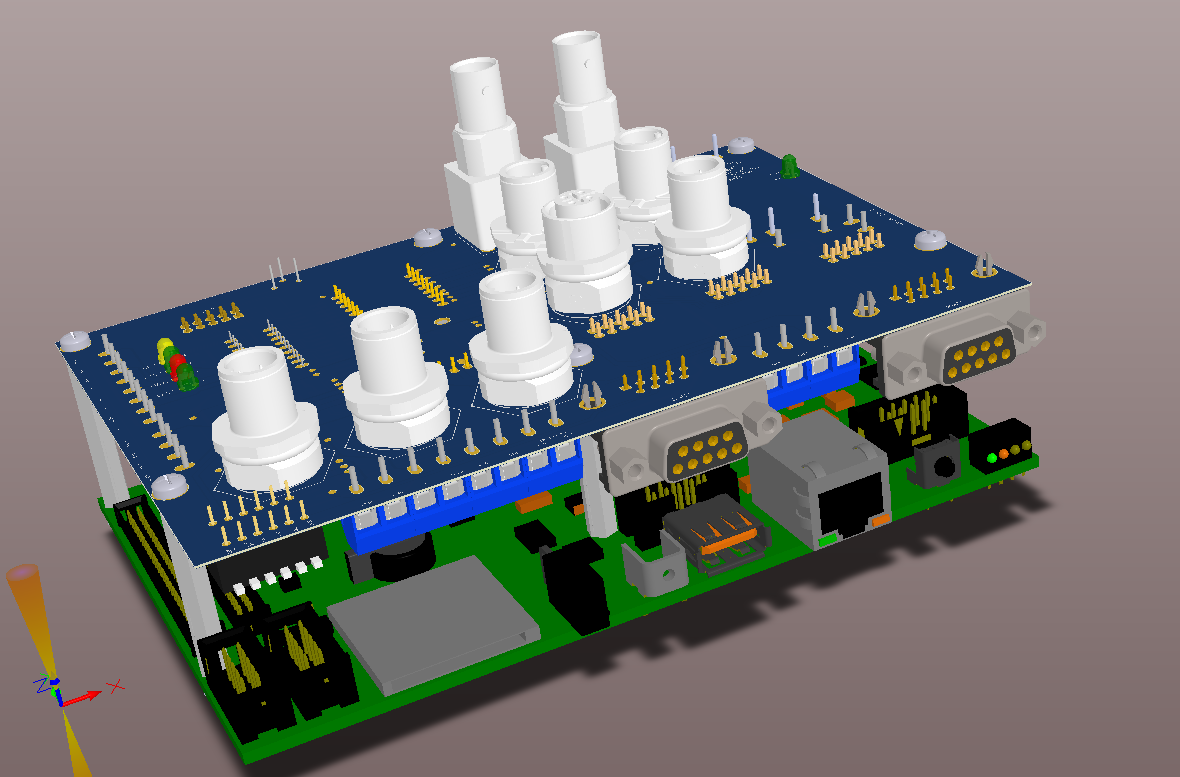
Picture 9: Measurment system with RIO
.jpg)
Picture 10: Photo of the connector board
The measuring system cooperates with the whole car and has the ability to remotely control the motor, omitting the driver. For safety reasons, this technique is not allowed during the race. However, the car is tested on a dyno test stand and in this case the driver is not needed.
Centralized measuring unit has several advantages including increased reliability and simplification of the car’s wiring. More details concerning the wiring can be seen in Picture 11.
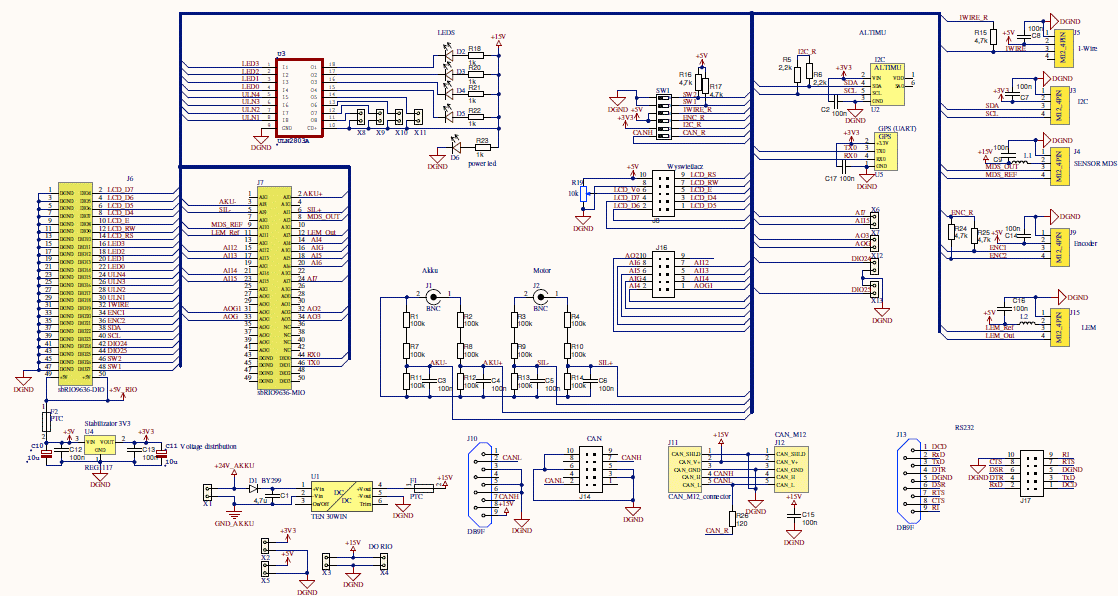
Picture 11: Electrical scheme
The supporting part
Research and development
Using NI products for simulations, we were able to speed up test and design process. We have built a pair of engine test bench stations. Stations are equipped in:
- cRIO + Ethernet RIO
- myRIO + Ethernet RIO
and consist of NI I/O modules. Main program is written in LabVIEW 2014, uses FPGA and object oriented Real Time aplication. Test bench is built so that the engine is running at full speed and is being affected by additional brake, just like in real car. Test bench allows for measurements of current the engine is fed with, its torque and RPM. The data collected is next used for analysis.
Usage of classes for RT program, i.e. for PID regulators, increases modularity, makes the program easier to maintain and makes the process of adding and changing the regulators and it’s parameters a lot faster. Thanks to NI object oriented software, we are able to quickly rearrange the regulator to modulate RPM, torque or motor’s current. It makes our engine test bench flexible and easy-to-use.
Usage of LabVIEW 2014 provides user friendly interface, which is clear and easy to obtain. Properly designed front panel is intuitive and allows all members of our team for individual tests.
Analysis and simulation
Data gathered and received by our network helped us improve the project. For instance, analyzing the voltage measurements, we were able to identify the 0.6V voltage dropout on our motor controller’s conduits, leading to significant energy loss. Processing the GPS data led us to reproduce the raceway profile and simulate the real tests. Thanks to our measuring systems built with NI products, were able to test different wheel rake parameters and transmission ratio offline, which saved a lot of time and resources in the development process.
Communication diagram
Software of our measurement system and a pit-stop consists entirely of 4 of cooperating applications. Two of them were mentioned above and concern the vehicle:
• FPGA of the car
• RT of the car
Other two applications belongs to the supporting part of the project:
• Data Server
• Pit-Stop
All threads and its relations in car application can be seen in the picture 12:
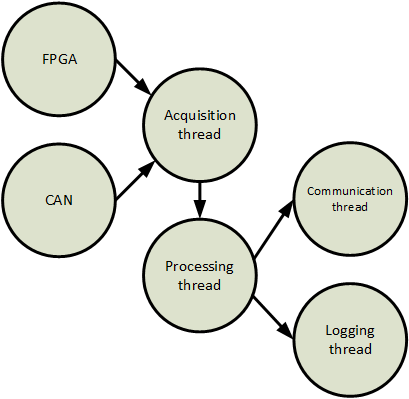
Picture 12: Data flow diagram
Data server
Data server is an application working on an additional computer that is waiting for connection opening from the cars and pit-stop. The purpose of this application is to redirect the connection between the cars and the pit-stop.
Pit-stop
This application collects and presents data from individual cars so that the service team knows its condition and where the car is on the raceway. This application also allows us to send commands, offers system tests and browsing already recorded data. Picture 13 presents front panel of working application:
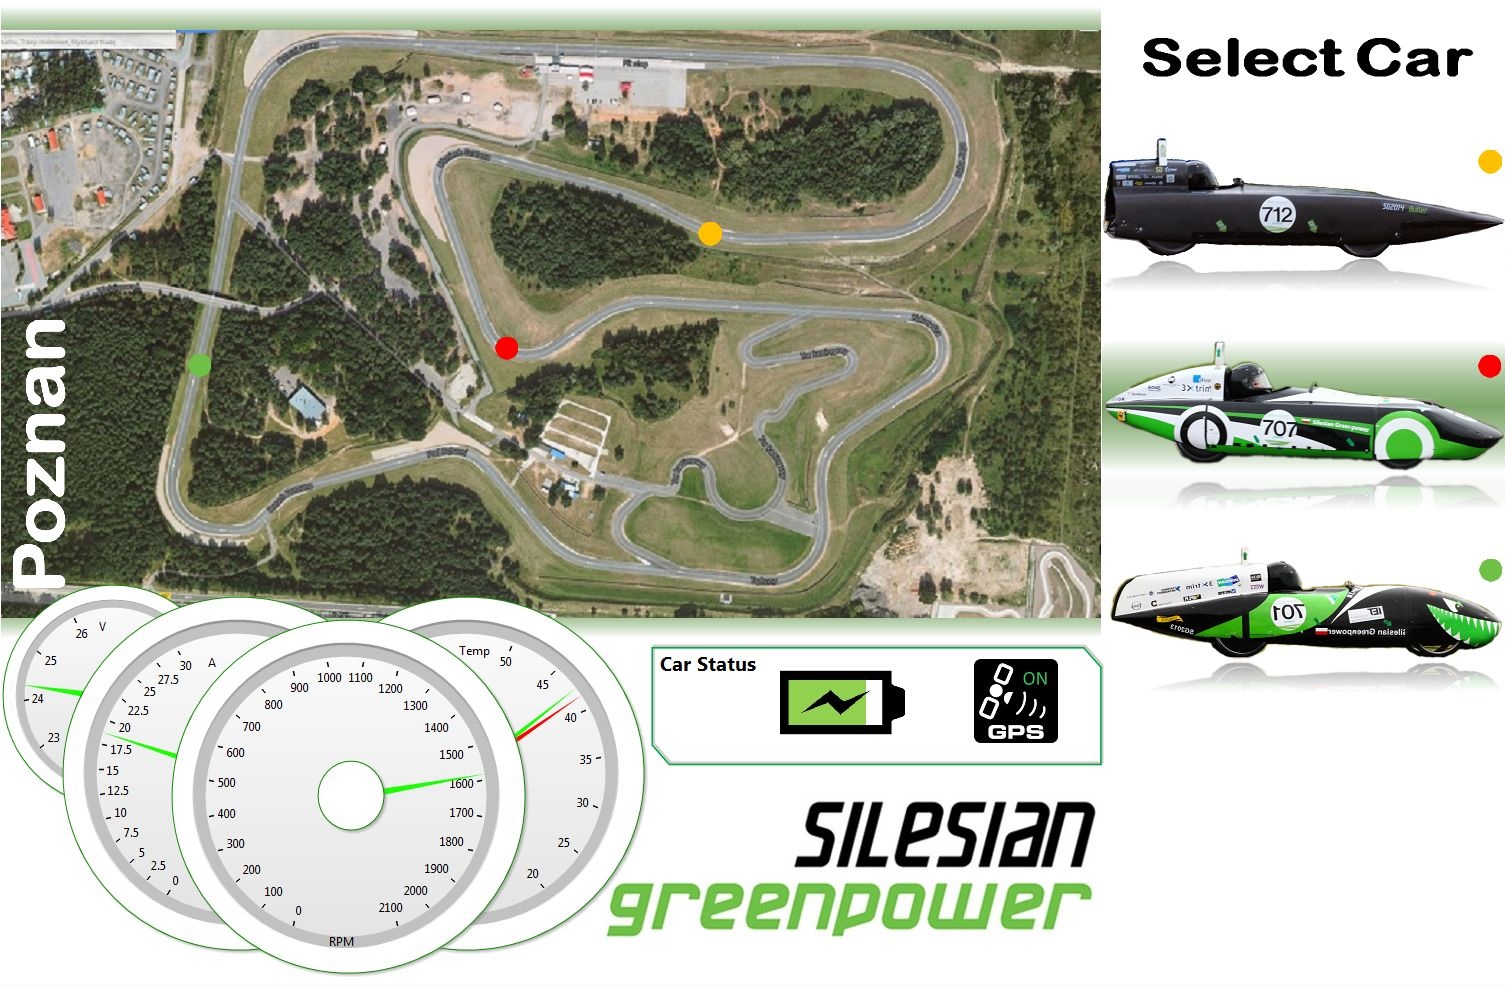
Picture 13: GPS Application (front panel)
Test stands
The main objective of the engine test stand is to provide racing conditions in laboratory environment. Actual components tested on the stand are: motor, batteries, high current beam, motor controller, measurement systems and many transducers. The elements taking part in the motion simulation of the vehicle include mechanical and electronic components cooperating with the control and measurement software. These components allow to simulate racing conditions, i.e. providing properly calculated load. The load may be put manually or it may be calculated, basing on the advanced mathematical models describing vehicle motion in particular racing conditions.
The software runs on cRIO 9012 controller which allows us to regulate chosen values that we want to check on the stand and also collects data from various sensors. Block diagram of the stand is attached below (picture 14):

Picture 14: Block diagram of the test stand
Engine test stand control software comes with three modes:
- Constant current
- Constant rotational speed
- Constant breaking torque
The core of the whole regulation system is the PID controller built in the FPGA circuit of the cRIO driver. All control signals and regulator settings are determined by actual operating mode of the stand. Picture 15 presents the regulation loop:

Picture 15: Regulation system of the stand
An additional advantage of the test stand is the ability to carry out automated tests consisting of a sequences, controlling test stand elements, often performed repeatedly. The test procedure and its parameters are set in the sequence file. This approach allows us to perform the exact same test for various motors.
LabVIEW implementation makes it easy to create a user control panel. The user is able to manipulate the test stand and also observe measured values diagrams during the test.
Software consists in three applications including FPGA module of cRIO and its RT system. The application that holds everything together is shown on the picture number 16. It allows the user to observe and manipulate the performance of various elements.
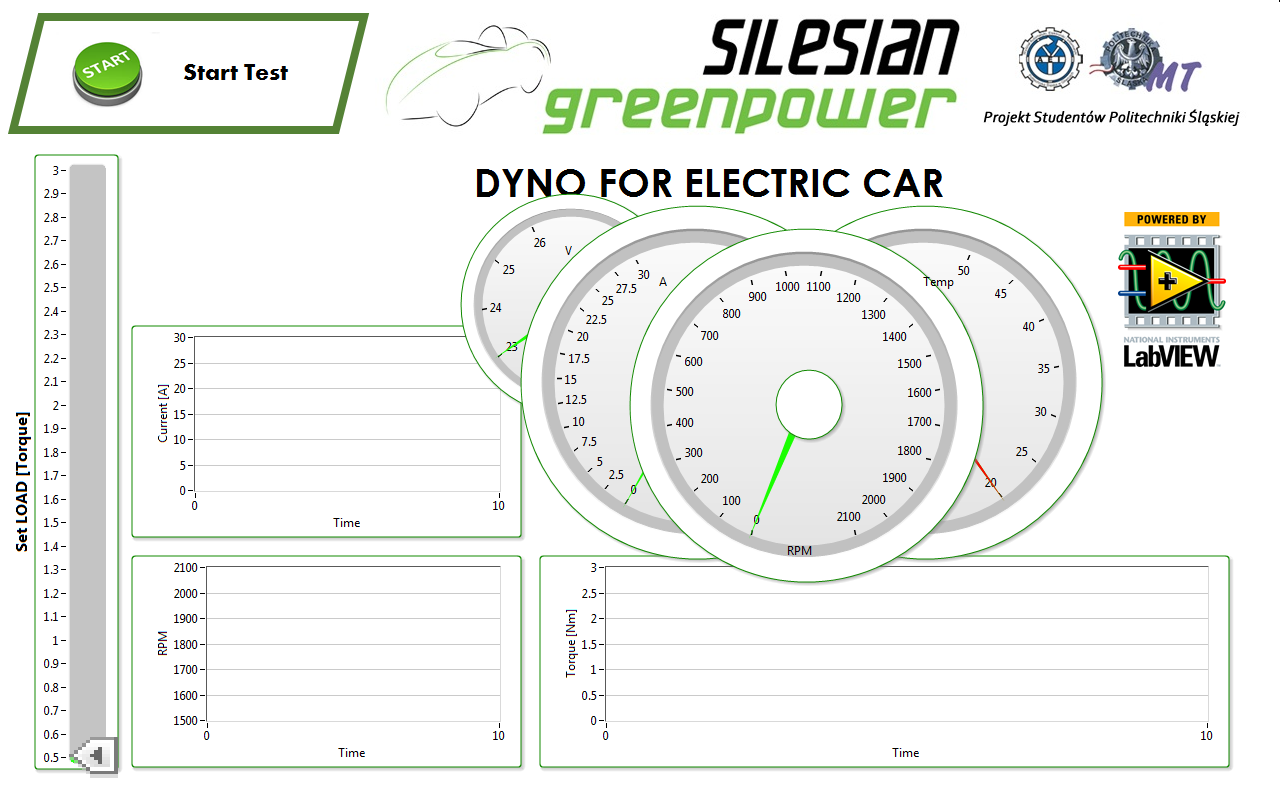
Picture 16: Test stand application (front panel)
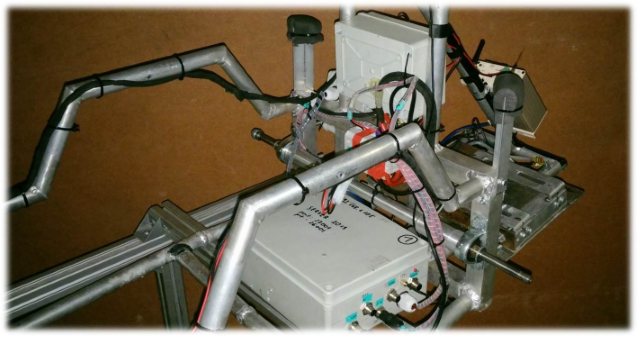
There are two different types of the engine test stands. One of them, presented in the Picture 17, is the pure laboratory stand on which we can conduct very specific tests of different parts of our race car such as the motor, batteries and motor controllers. The other one shown in the Picture 18 is created for testing the drive unit. This second stand allows also to test the whole vehicle with a slight change in the stand’s configuration, which means placing the whole car on the shaft of the test site. Performance of the stand is controlled by myRIO driver.
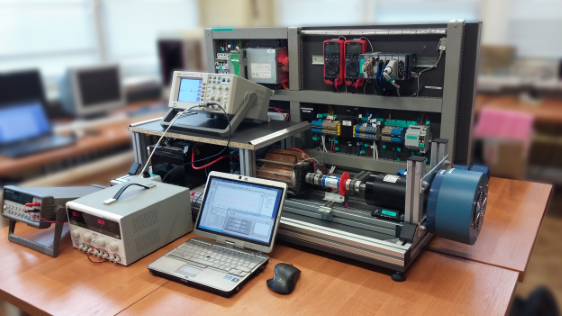
Picture 17: Laboratory site
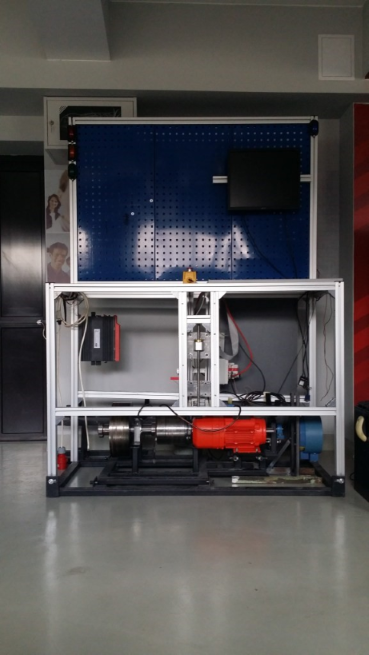
Picture 18: Drive unit test stand
One of the most important measurements conducted is the one that allows us to determine the efficiency of the motor in the function of temperature and rotational speed. Picture 19 presents an example test carried out with the test stand.
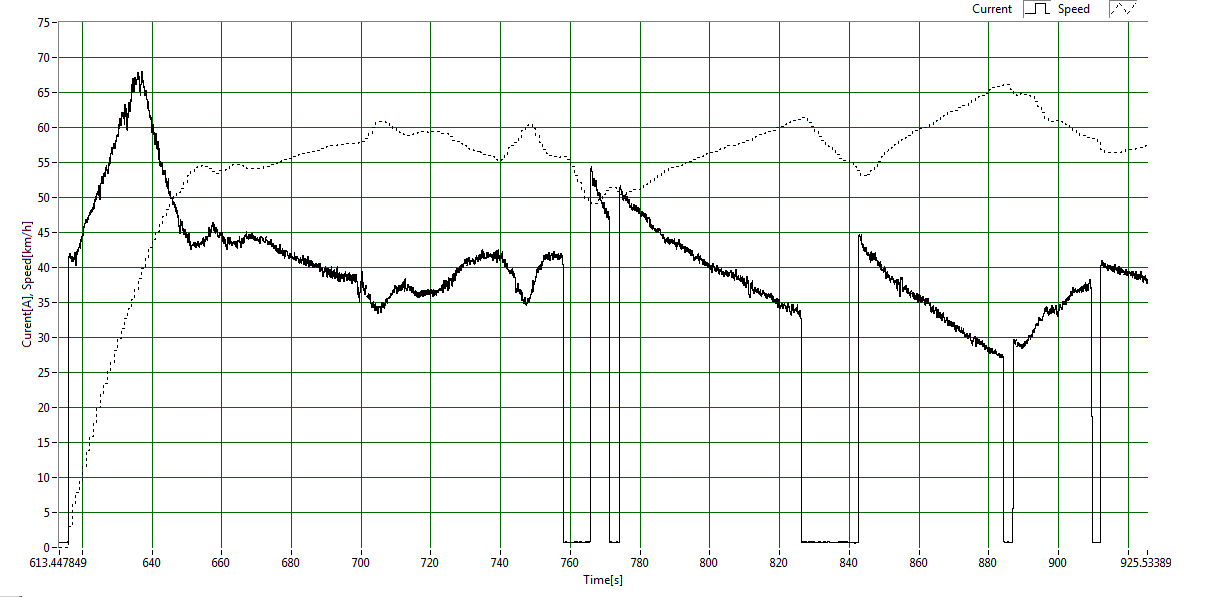
Picture 19: Example of the test carried out on the stand
The efficiency map
The stands also allows us to recreate the conditions occurring on the race track and to simulate them. The signals given on the input of the stand are mainly the values of the current on different parts of track corresponding to the breaking torque and speed. These data build an efficiency map presented in picture 20:
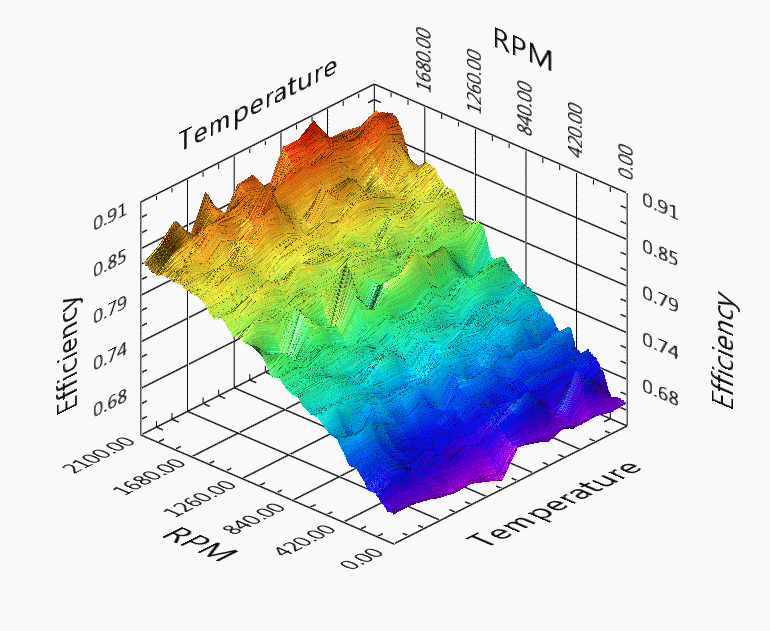
Picture 20: Efficiency map
Applications for battery testing
Additional application BatteryDischarge is used for testing the accumulators’ electrical capacity. Program controls a set of transistors via NI cDAQ-9174 outputs and allows to control the electric current in the circuit. The system implements overheating protection and prevents the accumulator from excessive discharge. Data collected during the tests are used to determine accumulator’s true capacity, classify them and group into pairs.
Measurement system for laminate burn-in
Burn-in of laminate is a key factor during manufacturing glass fiber or carbon fiber elements. After impregnating the fiber with rosin, it is placed in a furnace with temperature control system. For this purpose, we have built a chamber holding the form with plating components and four 3kW heaters. The chamber is controlled by myRIO unit, which measures temperature, controls the heating elements and serves as a safety driver.
Energy usage optimization: car driver’s assist
Driving style and cornering technique is a crucial aspect in Greenpower race series. Energy conservation during the race depends mostly on driver and this is where EnergyOptimization programs’ module, TrajectoryGenerator, comes to help. It is used to determine the optimal trajectory based on the car setup and actual weather conditions. Thanks to its integration with map, car drivers are able to see their mistakes and the trajectory they should use to consume as little energy as possible.
Thermal vision measurements
The project includes research on optimizing the engine cooling for improving its efficiency. Through the use of thermal imaging studies we know the precise temperature distribution on a running engine. Example image acquired with the camera is presented below (picture 21):
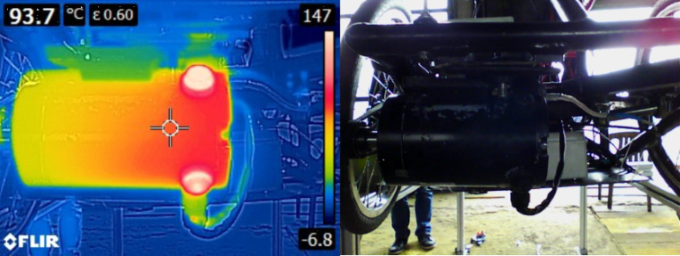
Picture 21: Temperature map acquired with thermal camera
Summing up
Silesian Greenpower is an research and development project realized at the Silesian University of Technology. Software and solutions presented in the document were being developed through past 2 years and are now fully functional and used in real cars during races.
