LVDT vs. Pressure Data Acquisition and Graph with DAQmx
- Subscribe to RSS Feed
- Mark as New
- Mark as Read
- Bookmark
- Subscribe
- Printer Friendly Page
- Report to a Moderator
Products and Environment
This section reflects the products and operating system used to create the example.To download NI software, including the products shown below, visit ni.com/downloads.
- Data Acquisition (DAQ)
Hardware
- LabVIEW
Software
- NI DAQmx
Driver
Code and Documents
Attachment
Overview
This code completes the task of sampling LVDT and pressure data simultaneously on the same board.
Description
Because LVDT sensors can provide a voltage which represents a linear displacement, the use of seeing how this displacement correlates with the applied pressure can be very useful. This program takes the sampled data and provides them in a well suited graph to show the relationship between displacement and pressure.
Requirements
Software
- LabVIEW 2009 or compatible
- DAQmx 8.9.5 or compatible
Hardware
- Most NI DAQ hardware with analog input. Most likely will require signal conditioning for LVDT and pressure signals
- LVDT sensor
- Pressure transducer
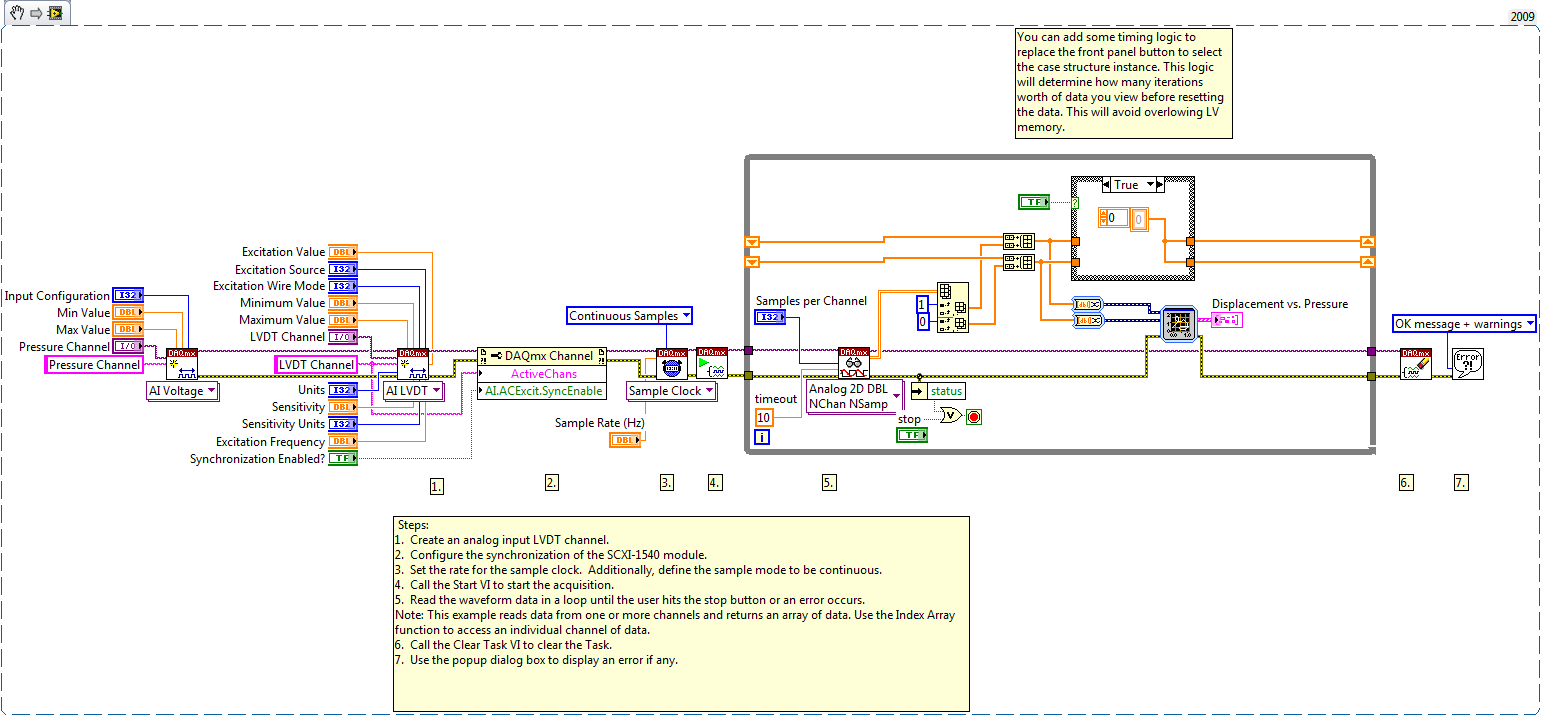
Steps to Implement or Execute Code
1. Open the VI
2. Select the individual AI channel for your LVDT sensor and your pressure channel.
3. Provide the timing parameters for your application.
4. Provide the LVDT parameters for your application.
5. Run the VI.
Additional Information or References
Notice this XY Graph appends previously sampled data with new data. For this reason there is a constant build up of data for the graph which can lead LabVIEW to run out of memory. To prevent this a boolean has been integrated to clear the graph's history. Use this periodically to prevent LabVIEW from running out of memory. Logic to automatically clear the graph after a duration of time can easily be added to the program
.**This document has been updated to meet the current required format for the NI Code Exchange.**
Group Manager for Application Engineering Specialists | Automated Test
NIC
Example code from the Example Code Exchange in the NI Community is licensed with the MIT license.
