- Subscribe to RSS Feed
- Mark Topic as New
- Mark Topic as Read
- Float this Topic for Current User
- Bookmark
- Subscribe
- Mute
- Printer Friendly Page
Multi-Y Graph Feedback
10-16-2013 01:49 PM
- Mark as New
- Bookmark
- Subscribe
- Mute
- Subscribe to RSS Feed
- Permalink
- Report to a Moderator
11-03-2014 12:58 PM
- Mark as New
- Bookmark
- Subscribe
- Mute
- Subscribe to RSS Feed
- Permalink
- Report to a Moderator
I am trying to recompile this for 2014 with no success. I've tried to recompile the 2013 build and tried creating my own distribution with the source from 2012 with very little success. I'm assuming when the workspace tries to run the VI, but it can't find dependency? No idea. My end goal is to just make a graph with 2 scales that are dynamically configurable.
Rob
11-03-2014 02:02 PM
- Mark as New
- Bookmark
- Subscribe
- Mute
- Subscribe to RSS Feed
- Permalink
- Report to a Moderator
Hi rkbull,
I apologize for the confusion. I realized that I did not include the project file (*.lvproj) which ties it all together in my source code. I've gone ahead and updated the page with the project file included so I would recommend redownloading and working from that version.
Lynn
Senior Systems Engineer
11-03-2014 02:40 PM
- Mark as New
- Bookmark
- Subscribe
- Mute
- Subscribe to RSS Feed
- Permalink
- Report to a Moderator
Helps a bunch Thanks!
Rob
11-08-2014 06:27 AM
- Mark as New
- Bookmark
- Subscribe
- Mute
- Subscribe to RSS Feed
- Permalink
- Report to a Moderator
Hello Sarci1,
i use your NI VeriStand Add-On: Multi-Y Graph for NI 2012. It works fine but I have some Problems with it. Maybe you can help me. The plc rate of the used pxi is 20khz. The Target Decimation in the system definition file is set to 100.
1. The History Length Option does not work for me. I think there is a bug with the set Target Decimation in the system definition. I set the History Length to 0,5 and the i choose a decimation of 1 in the graph options. It takes a very long time until the line disappeared.
2. How can I change the default background color of the plot when I place the custom control to the workspace?
With best regards Thomas
11-12-2014 03:12 PM
- Mark as New
- Bookmark
- Subscribe
- Mute
- Subscribe to RSS Feed
- Permalink
- Report to a Moderator
Hello Thomas,
Can you clarify what you mean by the Target Decimation in the system definition is set to 100? Are you referring to the Data Processing Loop decimation value that you configure under the controller page? If this is the case you are effectively telling the Data Processing Loop (DPL) to only execute at 200 Hz. This means that your Communication Loops are receiving updated data at a 200 Hz rate.
By setting the History Length to .5 you are telling the graph to only display 0.5 seconds of data and with a decimation of 1, you are requesting all points. Could you clarify what you mean when you say that it took a long time until the data disappeared? Is it displaying .5 seconds of data or no data at all?
In order the change the default background color, you will need to modify the source code. You can change the background color by setting the graph's Plot Area>>Colors>>BG Color property. The source code project is included on the page. Once making the background color changes to the VI, you will need to rebuild the build specification and place the contents of the Built directory in your <Public Documents>/National Instruments/<NI VeriStand version>/Display Templates directory with the workspace closed. When the workspace is reopened the newly modified object will appear.
Best Regards,
Lynn
Senior Systems Engineer
11-12-2014 03:47 PM
- Mark as New
- Bookmark
- Subscribe
- Mute
- Subscribe to RSS Feed
- Permalink
- Report to a Moderator
Hi Lynn,
So I successfully modified the code to have 2 configuratble y axes. The issue I have with the graph is when it is added to a workspace containing a simple graph it breaks the workspace and makes it unusable. If I delete all of the simple graphs in the workspace, then this display template will function. When I add multiple displays of this type to the workspace the buffer of the graph is unpredicatble. The first graph that is added has the correct or default buffer size of 10 seconds. All of the other graphs added after have an unpredictable buffer size or history length.
Rob
11-17-2014 11:09 AM
- Mark as New
- Bookmark
- Subscribe
- Mute
- Subscribe to RSS Feed
- Permalink
- Report to a Moderator
Would you be able to provide the *.lvproj for your modified workspace object. I know the issue with the simple graph and am looking into this here as well, however I cannot replicate what you are seeing with multiple instances of the Multi-Y graph so if I can get access to the source code you are working with I may be able to figure out what is happening.
Senior Systems Engineer
11-17-2014 01:08 PM
- Mark as New
- Bookmark
- Subscribe
- Mute
- Subscribe to RSS Feed
- Permalink
- Report to a Moderator
Hello Lynn,
thanks for your feedback.
Can you clarify what you mean by the Target Decimation in the system definition is set to 100? Are you referring to the Data Processing Loop decimation value that you configure under the controller page? If this is the case you are effectively telling the Data Processing Loop (DPL) to only execute at 200 Hz. This means that your Communication Loops are receiving updated data at a 200 Hz rate.
Yes, i'm talking about the Data Processing Loop decimation value.
Could you clarify what you mean when you say that it took a long time until the data disappeared? Is it displaying .5 seconds of data or no data at all?
The Graph is displaying 50 seconds of data when i'm setting the History Length to 0.5 and the Data Processing Loop decimation value to 100 (under the controller page). The Decimation in the Graph Setup was set to 1.
I think the there is a bug with the History Length when you use a Processing Loop decimation upper than 1 (under the controller page).
11-17-2014 04:16 PM
- Mark as New
- Bookmark
- Subscribe
- Mute
- Subscribe to RSS Feed
- Permalink
- Report to a Moderator
Hi Thomas,
You are correct. There was a bug with the Data Processing Loop decimation. I have gone ahead and updated the attachment (v1.1) fix to this bug. If you would prefer to make the changes to your version of the object, you can update the Get UDP Buffer Size.vi to include the Stream Rate calculation as shown below:
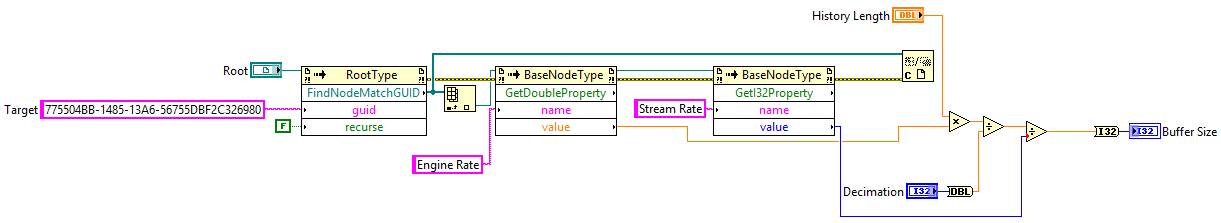
Best Regards,
Lynn
Senior Systems Engineer
