From 04:00 PM CDT – 08:00 PM CDT (09:00 PM UTC – 01:00 AM UTC) Tuesday, April 16, ni.com will undergo system upgrades that may result in temporary service interruption.
We appreciate your patience as we improve our online experience.
From 04:00 PM CDT – 08:00 PM CDT (09:00 PM UTC – 01:00 AM UTC) Tuesday, April 16, ni.com will undergo system upgrades that may result in temporary service interruption.
We appreciate your patience as we improve our online experience.
12-11-2013 08:12 AM
For example:

Why?
12-11-2013 09:53 AM
Because LabVIEW "grays out" the undefined array elements by painting over them with partially opaque background color. Arguably, it shouldn't be graying out completely transparent elements, but I think we just didn't anticipate that use case.
12-11-2013 10:08 AM
Christina_R wrote:
Because LabVIEW "grays out" the undefined array elements by painting over them with partially opaque background color. Arguably, it shouldn't be graying out completely transparent elements, but I think we just didn't anticipate that use case.
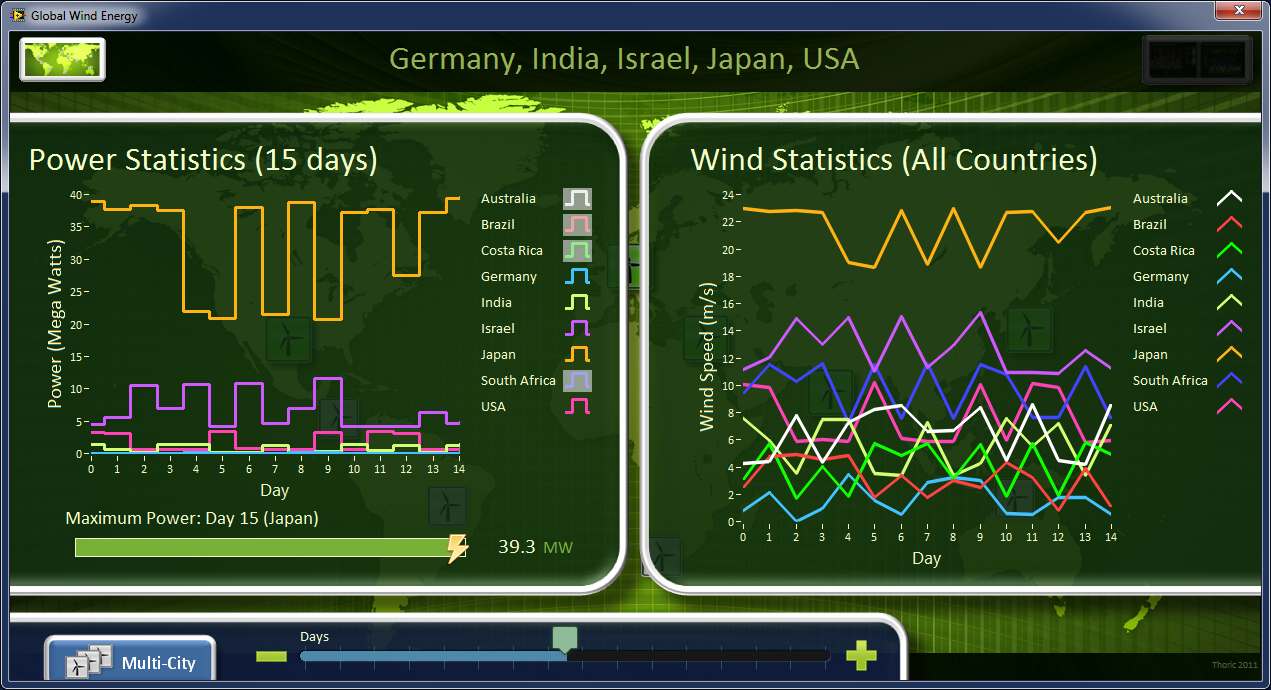
Another unanticipated use case, perhaps, is the grey box that appears behind the legend entry for hidden plots in graphs. In my User Interface entry I programmtically chose which plots to show, and I emply a lot of control overlays in this VI. For the plot lines that are hidden, you are presented with an ugle grey box behind the plot line symbol.
12-11-2013 10:17 AM
I think I understand now. The undefined elements are a mixture of transparent and background. When the control resides on the background only then transparent + background + background = background (transparent), but when they are placed over a non-transparent object then transparent + background + object = grayed out.
My use case is creating a pinable listbox (like your GSW) as an xControl. I have an array of picture controls on top of the listbox and undefined elements are showing as grayed out. The easy solution is to initialize the array to a large number of blank elements, but it intoduces other problems.
12-11-2013 10:20 AM
Yes, that's another "gray out" rectangle. What would you like it to look like? The same as when the plot is visible?
Thoric wrote:
Another unanticipated use case, perhaps, is the grey box that appears behind the legend entry for hidden plots in graphs.
12-11-2013 10:22 AM
Why are you using picture controls instead of the listbox item symbols?
Gleichman wrote:
I think I understand now. The undefined elements are a mixture of transparent and background. When the control resides on the background only then transparent + background + background = background (transparent), but when they are placed over a non-transparent object then transparent + background + object = grayed out.
My use case is creating a pinable listbox (like your GSW) as an xControl. I have an array of picture controls on top of the listbox and undefined elements are showing as grayed out. The easy solution is to initialize the array to a large number of blank elements, but it intoduces other problems.
12-11-2013 10:25 AM
No matter what solution is used I would expect the background to remain transparent, as set. Anything other than that is effectively a 'highlighting' of the item.
I think, in this case, the plot line and plot label text ought to be 'disabled', which would most likely involve making their foreground colours >70% transparent.
Christina_R wrote:
Yes, that's another "gray out" rectangle. What would you like it to look like? The same as when the plot is visible?
Thoric wrote:
Another unanticipated use case, perhaps, is the grey box that appears behind the legend entry for hidden plots in graphs.
12-11-2013 10:37 AM
A mock-up of what I mean by making the label and plot line ~70% transparent on, for example, India's plot:

12-11-2013 04:06 PM
One method I've used in the past to get around the greyed out elements "feature" is to resize how many elements of the array are displayed.
Use the Number of Rows / Number of Columns property node to set the displayed size of the array.
(I'm assuming every part of the array except it's elements are invisible in the final front panel.)
Obviously this doesn't work for hidden plots in graphs.
12-12-2013 03:05 AM
@TroyK. Yes, that's what I usually resort to, but to keep the same plot colours one has to programmatically reapply, from a local store, all the plot properties whenever you change the plot order (which is essentially what happens when you remove plots from the graph). This means a lot of data handling and property setting. A shame to have to do that when we have the lovely "hidden" property.
