Benchtop Measurement and Test
Distributed Measurement and Control
High-Performance Test
Systems Engineering Software
Perspectives showcases how NI sees what’s next in the world of test and technology.
You can request repair, RMA, schedule calibration, or get technical support. A valid service agreement may be required.
Provides support for NI data acquisition and signal conditioning devices.
Provides support for Ethernet, GPIB, serial, USB, and other types of instruments.
Provides support for NI GPIB controllers and NI embedded controllers with GPIB ports.
From Friday, April 19th (11:00 PM CDT) through Saturday, April 20th (2:00 PM CDT), 2024, ni.com will undergo system upgrades that may result in temporary service interruption.
We appreciate your patience as we improve our online experience.
02-24-2014 06:37 AM
hello
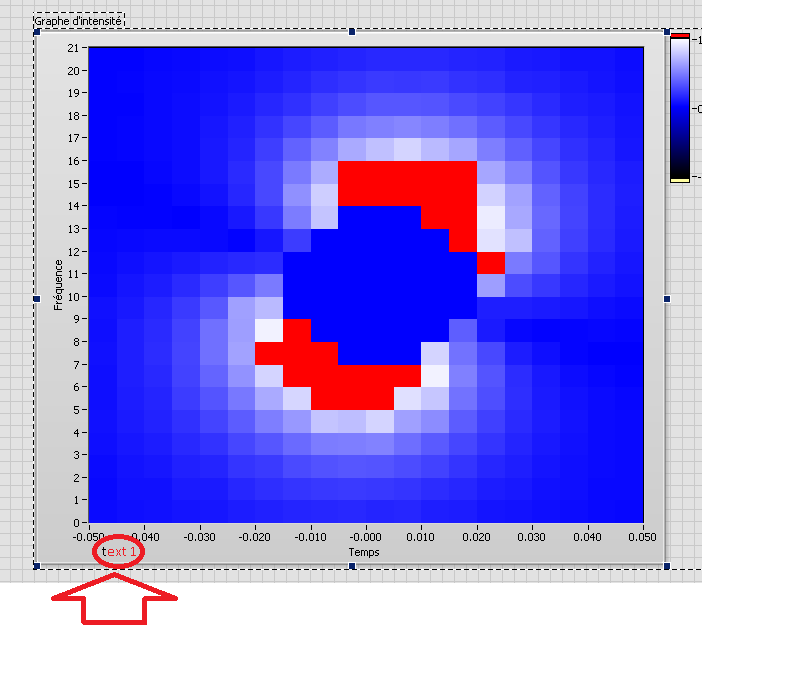
in a intensituy graph , I want place the scale text in the middle of the marker like excel
thanks a lot
02-24-2014 06:52 AM
Fake the scale by using a (transparent) string control!
I really do think such discussions (on programming issues) should be made in the LabVIEW forum…
02-24-2014 08:11 AM
i' m sorry but i don't want fake the scale
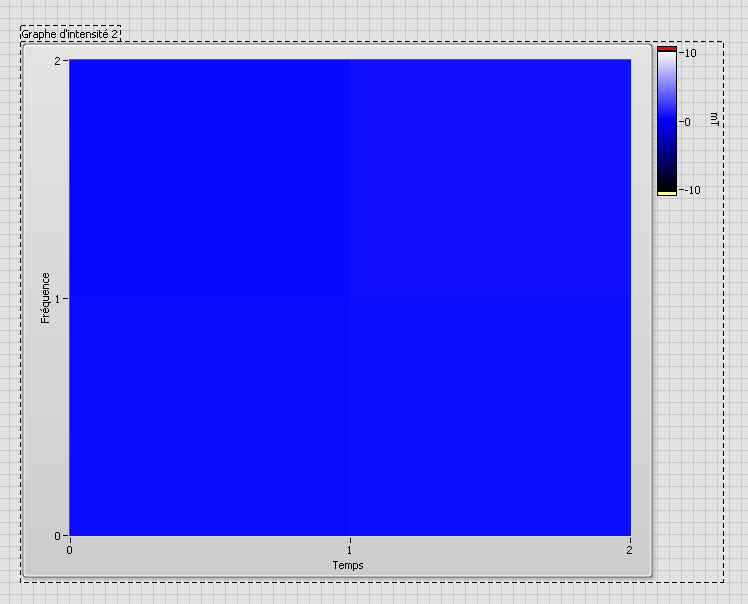
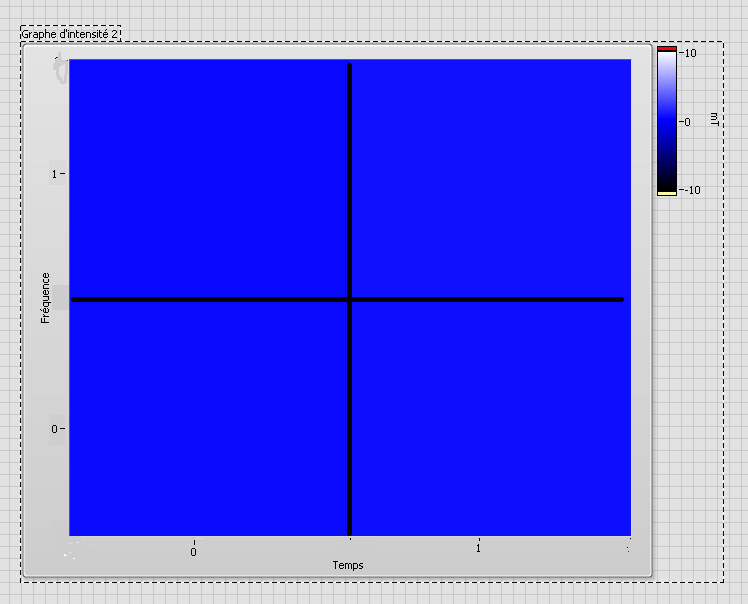
i want put the marker in the middle of the scarre mesure like this
to
wathever the scale (2 or more).
thanks
02-24-2014 09:26 AM
Hi jerome,
you cannot put values in between the markers. That's a limitation of the current intensity graphs!
But I remember there was a related LabVIEW idea you can vote for! Please search on your own here!
What do you need our team of experts to assist you with?
Thanks!
We'll be in touch soon!