- Subscribe to RSS Feed
- Mark Topic as New
- Mark Topic as Read
- Float this Topic for Current User
- Bookmark
- Subscribe
- Mute
- Printer Friendly Page
ECG feature extraction
Solved!06-20-2014 01:07 AM
- Mark as New
- Bookmark
- Subscribe
- Mute
- Subscribe to RSS Feed
- Permalink
- Report to a Moderator
hi all,
I'm a begineer in labview
I want to ask about the QRS complex detection.
I would like to ask why the ECG feature extraction can not show the results even though the incoming signal and detected on the ECG in raw ECG and ECG feature extraction still does not display the result?
I use real ECG signal and LIFA
anyone can help?
please help urgent
Regard
Asqhallaniy
Solved! Go to Solution.
06-20-2014 01:25 AM
- Mark as New
- Bookmark
- Subscribe
- Mute
- Subscribe to RSS Feed
- Permalink
- Report to a Moderator
Hi,
You mean you could not see the results on your "Denoised Signal" Waveform graph? This is expected. You need to connect the ECG feature results to some graph control to show.
Please refer to the example - You LabVIEW install folder\examples\Biomedical\Biosignal\ECG Feature Extractor.vi. In the diagram, there is some code marked as "4.Visualize and analyze extraction results.".
Thanks!
06-20-2014 01:45 AM
- Mark as New
- Bookmark
- Subscribe
- Mute
- Subscribe to RSS Feed
- Permalink
- Report to a Moderator
Nope, it can show output from denoise signal, but I can't see the result from "ECG feature extraction" although when I run the vi. there's input from ECG raw and ECG signal but there's no any output showing
06-20-2014 01:51 AM
- Mark as New
- Bookmark
- Subscribe
- Mute
- Subscribe to RSS Feed
- Permalink
- Report to a Moderator
I notice that your input does not have sampling info - dt. So ECG Feature Extractor will regard your input as sampling rate =1, thus your signal will be 1000 seconds which leads to no detected beats. Please add a valid dt in your waveform.
06-20-2014 02:21 AM
- Mark as New
- Bookmark
- Subscribe
- Mute
- Subscribe to RSS Feed
- Permalink
- Report to a Moderator
here the picture when i run the vi.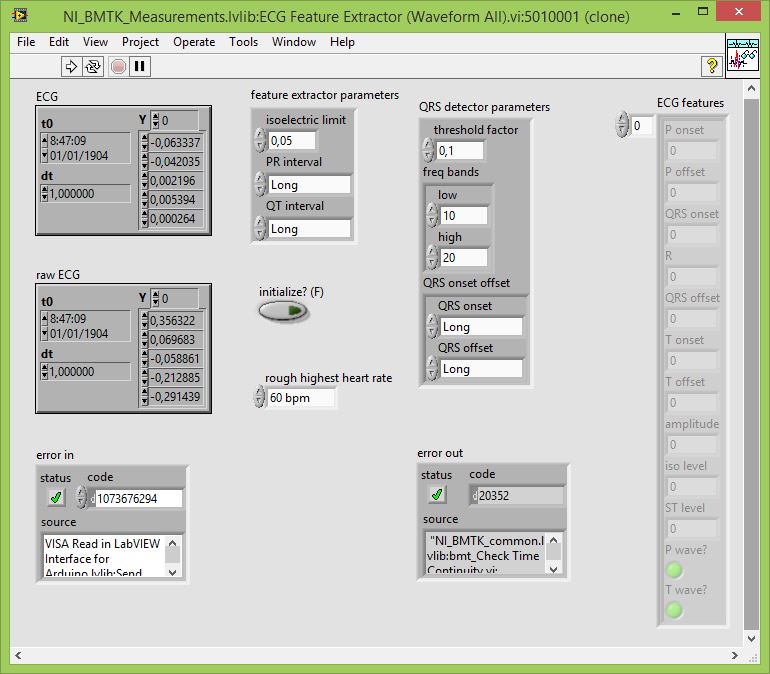
06-20-2014 02:25 AM
- Mark as New
- Bookmark
- Subscribe
- Mute
- Subscribe to RSS Feed
- Permalink
- Report to a Moderator
as you've said the dt value = 1
then what should I do?
how do I know the valid dt value should be?
06-20-2014 02:45 AM
- Mark as New
- Bookmark
- Subscribe
- Mute
- Subscribe to RSS Feed
- Permalink
- Report to a Moderator
You need to know how many samples you acquire in one second. Then use build waveform functions to set the dt. This is a general LabVIEW question. If you don't know how to do that, please call NI support.
Thanks!
06-20-2014 03:04 AM
- Mark as New
- Bookmark
- Subscribe
- Mute
- Subscribe to RSS Feed
- Permalink
- Report to a Moderator
thank you so much.
best regards

06-24-2014 03:56 AM
- Mark as New
- Bookmark
- Subscribe
- Mute
- Subscribe to RSS Feed
- Permalink
- Report to a Moderator
hello again,
Now I can show the calculation from calculate ECG feature stats.vi and show the ecg signal from show ECG waves.vi, but why all the ecg wave was colored green? not as the example which colored white red and green .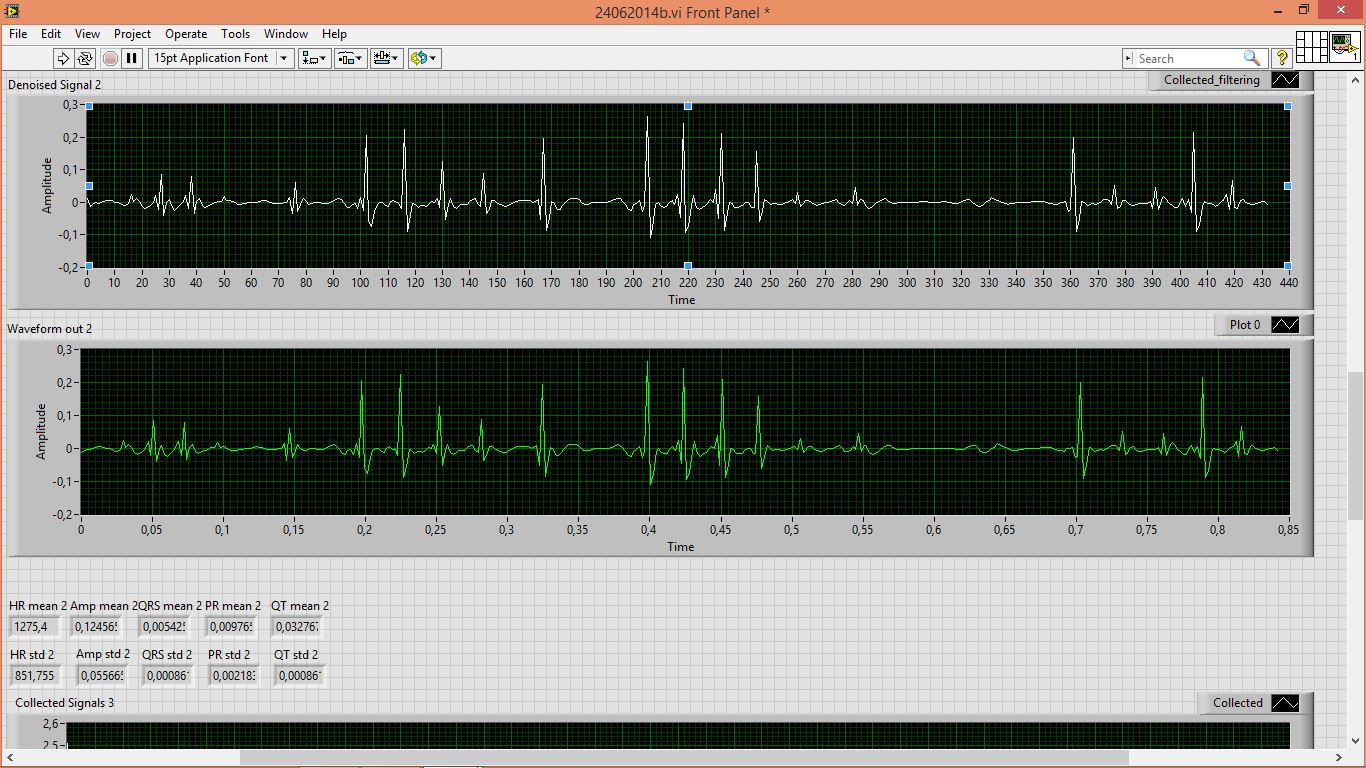
please help
thank you
06-24-2014 04:01 AM
- Mark as New
- Bookmark
- Subscribe
- Mute
- Subscribe to RSS Feed
- Permalink
- Report to a Moderator
Hi,
There should be other plots. You could enlarge the plot legend (top right of the graph) to see others and change their name, colors.
Thanks!
ZJ
