XGrapher - Xcontrol Waveform Graph
- Subscribe to RSS Feed
- Mark as New
- Mark as Read
- Bookmark
- Subscribe
- Printer Friendly Page
- Report to a Moderator
Code and Documents
Attachment
UI Controls Category Winner
Summary:
Visualizing data from your acquisition project can be a pain when trying to zoom, scroll and manipulate the view using standard LabVIEW Graph controls. In order to alleviate this problem (and to possibly win an iPad), I have developed the Xgrapher. The three videos I added below explain how to use the xcontrol and the demo vi associated with it.
Function:
The Xgrapher is an Xcontrol that consists of a standard waveform graph, but also contains a thinner graph called a 'Timeline'. This timeline shows all the data available, and allows a user to zoom in or zoom out by clicking and dragging cursors. Dig through the demo vi to use the Xcontrol and all of its features. When you're done, open up the Xcontrol and see how all the nifty user interface tricks are done. I'm sure some of you have better ways of doing things. Both the demo vi and Xcontrol are documented thoroughly to provide insight as to why I did certain things.
Features:
- Simple Xcontrol integration into your project
- Multi-plot support
- Programmatically move cursors using property nodes
- Xgrapher is fully resizable during runtime and will scale appropriately
- Visible or invisible scales
- Crosshair dot lets you track points using your mouse
- Crosshair dot snaps to nearest plot
- Programmatically turn on and off cursor redraw (wont refresh UI until user action is complete)
- General graph features still available such as: line thickness, plot color, aliasing, etc.
Steps to execute code:
- Download zipped folder and unzip to your machine
- Run XGrapher Demo.vi
- Click the Instructions Link if necessary
- Vote for me!
Screenshots:
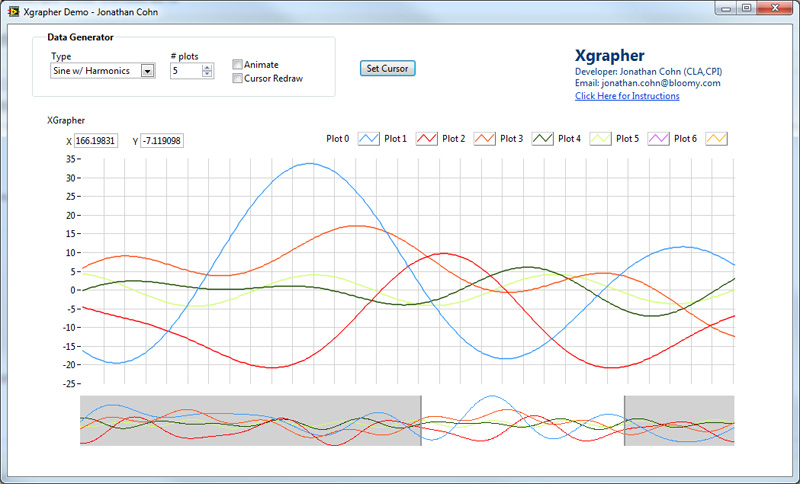
Multiple Sine waves with random oscillations
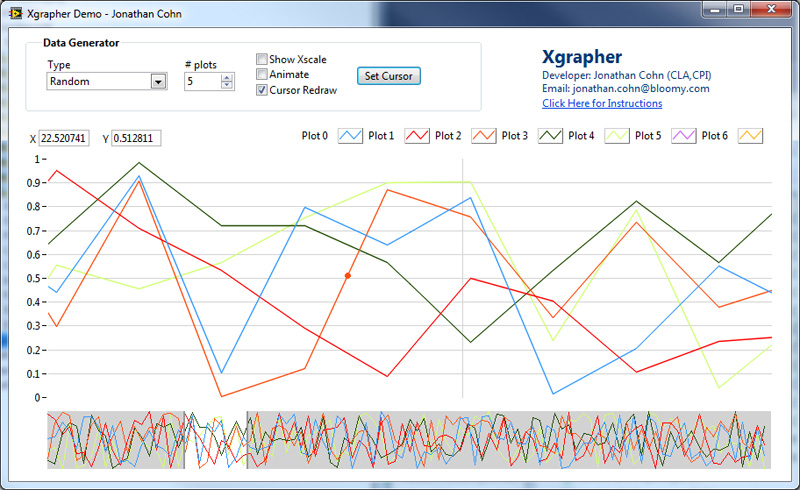
5 Ugly noise plots (mouse is tracking the orange plot)

Single sine wave with x-scale turned on
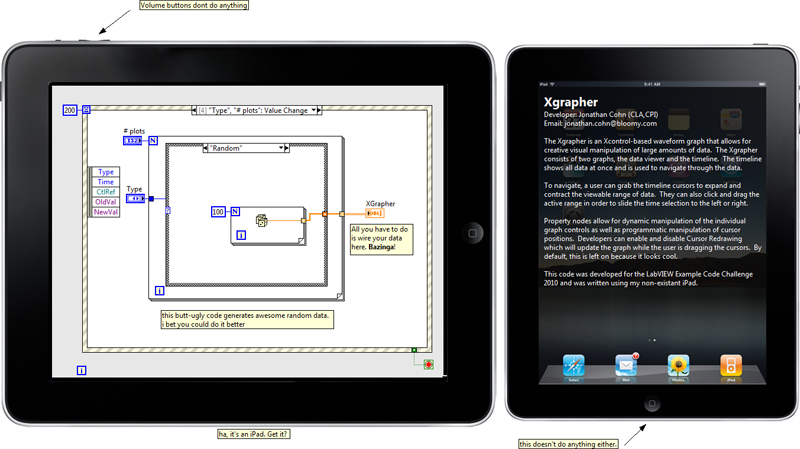
Yea, my block diagram is built inside an iPad. You got a problem with that?
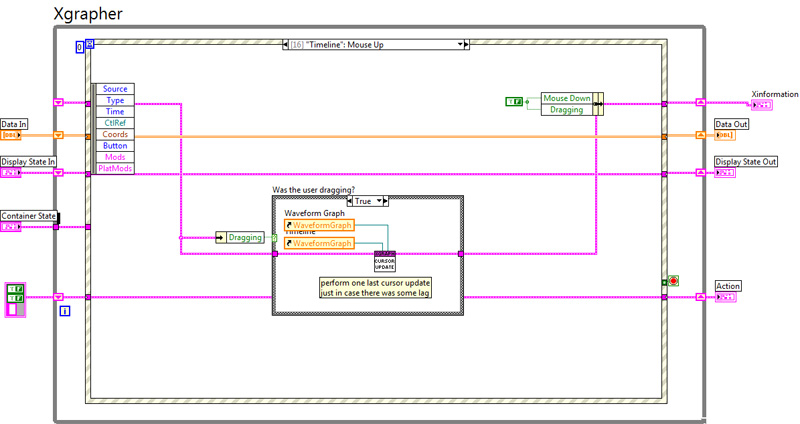
Xcontrol Block Diagram

VI Snippet:
I'm not really sure how VI Snippets work with xcontrols, so i'd rather not post a snippet here.
VI attached below
Built natively in LV2009
Also available in: 8.5
Example code from the Example Code Exchange in the NI Community is licensed with the MIT license.
- Mark as Read
- Mark as New
- Bookmark
- Permalink
- Report to a Moderator
Did you attach the zip file because Im not seeing it. On a side note I do like what you did with the Ipad pic.
Just trying to spread the LabVIEW love.
- Mark as Read
- Mark as New
- Bookmark
- Permalink
- Report to a Moderator
Hey Herrlin, I wasnt ready to publish this document yet, but it looks like if you make a new revision of it, it automatically publishes the older version. I'll have it back up in a few days when I'm ready.
- Mark as Read
- Mark as New
- Bookmark
- Permalink
- Report to a Moderator
I see. I feel as though I have just been flashed an ace and now I’m waiting to see a full hand. I have been thinking of an idea for another entry and you may have motivated me to follow through on it. I guess the question is if I can compete in the sex appeal department, also if my wife will tolerate another coding session, probably not.
Just trying to spread the LabVIEW love.
- Mark as Read
- Mark as New
- Bookmark
- Permalink
- Report to a Moderator
Suspense is part of his winning strategy 
[will work for kudos]
- Mark as Read
- Mark as New
- Bookmark
- Permalink
- Report to a Moderator
Ladies and Gentlemen, I apologize for the delay, but it's finally here.
...with 12 hours to spare  Thanks for waiting.
- Mark as Read
- Mark as New
- Bookmark
- Permalink
- Report to a Moderator
I've added three screencast videos to show off some features of the Xgrapher.
- Mark as Read
- Mark as New
- Bookmark
- Permalink
- Report to a Moderator
Shred,
Nice Concept. But I found the following problems when I tried out this VI. I don't know if its only me, or anyone else are facing these problems:
1. Using the "Animate" option with "Sine" wave, it does not create a sine wave, but draws some random values on the graph.
2. Now if I unselect "Animate" and change number of plots to 4, from say 2, and then select "Animate" again, the number of plots will reset back to its previous value i.e. 2
3. After about 30 seconds of doing "Animate" drawing, the UI stops responding/gets too slow and the processor usage shoots up to 100%
4. The timeline is inconsistent and dragging the mouse over it randomly works. After 30 seconds, this gets slow and stops responding completely in further few seconds
5. After about 1 minute later by keeping the "Animate" option selected, my PC was dead slow and the processor usage was constant at 100%. UI won't respond at this point at all and I have to force exit LabVIEW using Task Manager to end LabVIEW task.
6. At some point, even when my "Animate" option was unselected, it was still drawing the graph, with the time line getting filled up completely.
I am not trying to give any negative review, but just wanted to let you know so that you can upload a fixed version of this
Otherwise, I really like the concept, but only I won't be able to use this right away in my application.
Regards,
FraggerFox
Certified LabVIEW Architect, Certified TestStand Developer
"What you think today is what you live tomorrow"
- Mark as Read
- Mark as New
- Bookmark
- Permalink
- Report to a Moderator
Hey FraggerFox, I have to admit, I didn't spend too much time perfecting the animation part of the demo application for the contest. In the end, the xcontrol is just a waveform graph, so it should be able to handle data being pumped into it from a source. My timeout state is where the animated data is being generated, and it's terribly inefficient. It also doesn't look at any of the data generation parameters (# of plots or waveform type). I just hard coded that in.
As for the 30 second freeze, i was unable to reproduce this. I do see my memory usage increase over time, but that should happen considering all the data i'm storing in that graph and feedback node. Does the normal non-animated data freeze your computer when moving cursors?
Now, If you're animating multiple plots at once and you've got a ton of a data, this is a good placeto turn off cursor redraw. this will reduce processing time necessary to redraw every single mouse coordinate change.
I've uploaded a newer version of this which creates better animated data (sine waves instead of random noise)
In future revs, i plan to have a function that resamples the data in the timeline window if you've pumped a ton into to the Xgrapher. This would give the illusion that the data doesnt have much detail, but as you zoom in, more details appear.
Thanks for your comments...hopefully this will help improve this plugin and make it more useful to others
- Mark as Read
- Mark as New
- Bookmark
- Permalink
- Report to a Moderator
^ ^
I hope that does not reduce the number of votes for my entries!
Certified LabVIEW Architect, Certified TestStand Developer
"What you think today is what you live tomorrow"
- Mark as Read
- Mark as New
- Bookmark
- Permalink
- Report to a Moderator
I don't like the fact that you protect against the two cursors at the bottom from crossing by restoring the original locations if it happens. The program should not impose strict rules like that to the user.
What I typically do is just use the Min&Max function on the two cursor positions and treat whatever has a lower x value as the left cursor.
This is more intuitive and also potentially more functional. For example when looking at segments, we might want to make the upper bounds x as the new lower bounds. With my suggestions, all we need to do is drag the lower cursor above the upper cursor.
- Mark as Read
- Mark as New
- Bookmark
- Permalink
- Report to a Moderator
Great job. You've got my vote. Any chance you'll make an xy graph one?
- Mark as Read
- Mark as New
- Bookmark
- Permalink
- Report to a Moderator
So great output. Thank you so much.
- Mark as Read
- Mark as New
- Bookmark
- Permalink
- Report to a Moderator
I started playing with the xcontrol on a simple test VI, writing an array of points to the graph and have found a few issues:
1. Upon first run, the right cursor of the full range data appears outside of the data set if the data set is too small., so you are required to pan the zoom window to the left in order to expose the right cursor.
2. If you drag the right cursor outside of the graph bounds, the graph thinks you've started a pan action when you move the mouse back within the graph bounds.
3. Bad things happen if you use 'run continuously' on the vi containing the xcontrol and change the graph data across run iterations. For example, after stopping the run function, the xgraph continues to alternate between previous data sets on it's own.
Otherwise, I think this concept is great!
- Mark as Read
- Mark as New
- Bookmark
- Permalink
- Report to a Moderator
Thanks for this awesome example, Shred, and congratulations on your victory!!
For the sake of consistency, I want to point out that this incredible functionality is something we've included with NI DIAdem out-of-the-box for nearly a decade now. DIAdem is designed as more of an offline data postprocessing solution, whereas Shred's tool would probably be best suited for an inline solution (built using LabVIEW, of course).
Feel free to check it out if you're interested.
Derrick Snyder
Product Manager
NI DIAdem
- Mark as Read
- Mark as New
- Bookmark
- Permalink
- Report to a Moderator
Thanks Derrick!
Although, advertising your product on my document will cost you 41 dollars a month. I'm charging you up front for the year....equating to one (1) $500 iPad.
- Mark as Read
- Mark as New
- Bookmark
- Permalink
- Report to a Moderator
Very nice piece of code. One glitch in the demo is that cursor redraw starts out false even though the control is checked so to get the cursor redraw mode to work you have to uncheck it and check it again. Not sure why it defaults to false, but that is what happens. This is after compiling for Mac OS X which should be consistent unless it is a LV bug.
- Mark as Read
- Mark as New
- Bookmark
- Permalink
- Report to a Moderator
This is very, very cool functionality that I might like to include in some of my apps. Are there restrictions on using contest code (and this control in particular) in other apps?
BTW, I agree with you... feedback nodes are badass.
- Mark as Read
- Mark as New
- Bookmark
- Permalink
- Report to a Moderator
Just curious to know if anyone has plans to extend the xgrapher or do we have to wait until NIWEEK to see that?
- Mark as Read
- Mark as New
- Bookmark
- Permalink
- Report to a Moderator
Yes of course DIADEM has lots of cool features but what would be even cooler is if DIADEM had .net custom controls that could be integrated into LabVIEW.
- Mark as Read
- Mark as New
- Bookmark
- Permalink
- Report to a Moderator
All I can Say is Cool so so cool had a application in work and the guys were going mad finding peaks and this fixed all my problums, Five minutes to 30 seconds ,, Thank you ..........................
- Mark as Read
- Mark as New
- Bookmark
- Permalink
- Report to a Moderator
Hi,
When i load a big data file it goes really slow... do you have any tips?
Regards,
Thijs
- Mark as Read
- Mark as New
- Bookmark
- Permalink
- Report to a Moderator
ths,vote for u!!!
