- Document History
- Subscribe to RSS Feed
- Mark as New
- Mark as Read
- Bookmark
- Subscribe
- Printer Friendly Page
- Report to a Moderator
- Subscribe to RSS Feed
- Mark as New
- Mark as Read
- Bookmark
- Subscribe
- Printer Friendly Page
- Report to a Moderator
Video showing actual performance of the Experiment.
Contact Information
University: College Of Engineering, Pune
Team Members: Prashik D. Khadse
Anjali A. Patil,
Rajesh S. Kaje,
Rohan A. Paranjpe,
Faculty Advisor: Prof. P.R. Dhamangaonkar
Email Address: prashik.khadse@gmail.com,
Project Information
Title: Virtual Experimental Set-up to Study Thermodynamic Ideal Gas Processes.
Description:
Virtual labs are a fusion of creative engineering and objective conceptualization techniques to yield an interactive experience. It is a set of teaching and learning tools designed to enhance a student's learningexperience. Computer animation and visualization can help to illustrate complexphysical phenomena easily. Furthermore, they give us additional insight intoproblems during classroom teaching as well as in the individual study process.
Products:
LabVIEW 8.6
The Challenge:
Todevelop experiment “Study of Ideal Gas Processes”, it is mandatory to understand concepts like pressure, volume, temperature, enthalpy, entropy, heat input, and internal energy, work done by the system or on the system, PV and PTrelationships. There are five ideal gas processes viz.
- Constant volume process
- Constant pressure process
- Constant temperature process
- Adiabatic process
- Polytropic process
Each process shows specific interrelationship between initial conditions of pressure, volume, temperature and final conditions of pressure, volume, temperature. Final conditions of pressure, volume and temperature are kept as outputs. It was decided to keep work done, change in internal energy and change in enthalpy will also be calculated from the final conditions by using formulae. Initial conditions of pressure, volume and temperature were decided as inputparameters. The main governing parameter for obtaining graphical relationshipis kept as heat supplied. Taking air as medium for experiment, followingconstants are used:
- Mass of air = 1 kg
- Cv of air = 0.717 kJ/kg K
- Cp of air = 1.005 kJ/Kg K
- R – characteristic gas constant for air=0.287 kJ/kg K
Hence the inputs are taken as initial conditions for pressure, volume andtemperature. Representation of input and output parameters can be done by piston cylinder arrangement and pressure-volume graph, pressure-temperaturegraph.
The Solution:
The formula node is used to calculate work done, change in internal energy andenthalpy. As there are five processes in the experiment, managing of individual block diagram was difficult and troubleshooting was even more critical and this is done by the use of case structure. Heat supplied is used as controlling parameter for obtaining results. Then values for final conditions of pressure,volume and temperature as well as other desired outputs could be obtained. Representation of relationships between input parameters in graphical form is the key aim of the experiment which is not possible with this attempt as output parameterswere not in array form. To solve the problem of representation on XY graph, use of XY chart is done. TheXY graph is converted to XY chart by making use of while loops along with shift register. This enabled XY graph to represent previous reading also.
The use of property node is done to represent moving piston cylinder arrangement as per the results obtained. Property nodes are also used for sequential displaying of all parameters on front panel in desired order.
Outputs are represented in observation table on front panel. For obtaining this table in user accessible form, two D array and its local variables is used. For representing observationtable on panel, standard array is used. While loop is used for sequential dataentry in the table. All the data was converted from numeric form to fractional string and given to observation table. Data from observation table is made available to user in excel sheet form. For doing this write to spreadsheet file function is used.
To facilitate the performance and use of setup, instructions are also provided inprocedure window. User can access detailed instructions by open a separate VI on click of ‘Theory’ button. This is achieved by use of special property nodes and invokes nodes. For continuous execution this process is achieved by use of while loop. The VI property is changed to run on start for execution of VI as soon as it is opened. This avoided the need of providing separate start buttonon front panel.
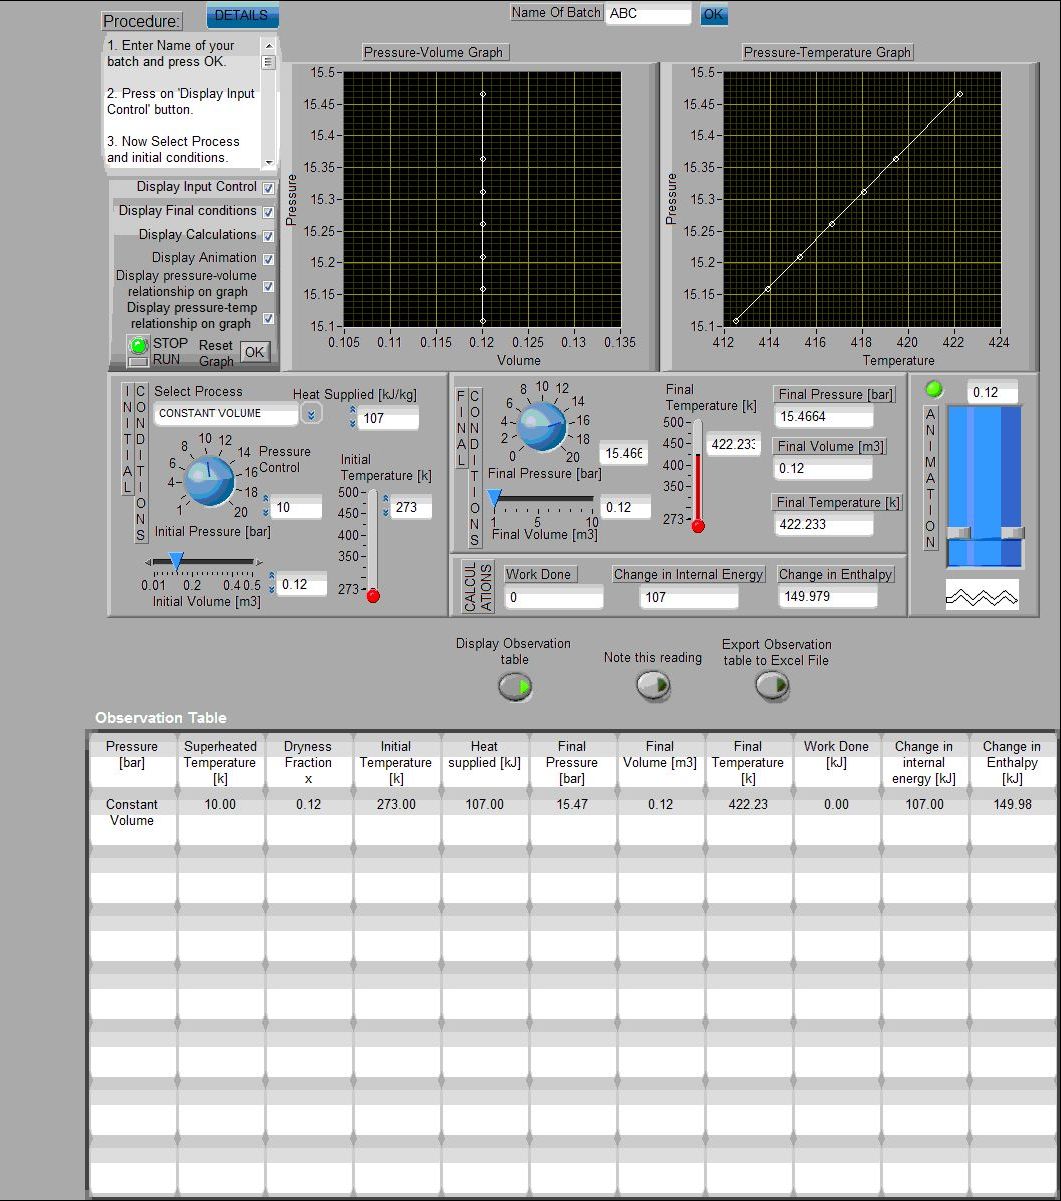
Figure: Virtual Experimental Set-up as seen on Front Pannel
Open file named 'Study of Ideal Gas Processes Experiment.vi' in the attached zip folder.
- Mark as Read
- Mark as New
- Bookmark
- Permalink
- Report to a Moderator
Hi Prashik Khadse,
Thank you so much for your project submission into the NI LabVIEW Student Design Competition. It's great to see your enthusiasm for NI LabVIEW! Make sure you share your project URL with your peers and faculty so you can collect votes for your project and win. Collecting the most "likes" gives you the opportunity to win cash prizes for your project submission. If you or your friends have any questions about how to go about "voting" for your project, tell them to read this brief document (https://forums.ni.com/t5/Student-Projects/How-to-Vote-for-LabVIEW-Student-Design-Projects-doc/ta-p/3...).
I'm curious to know, what's your favorite part about using LabVIEW and how did you hear about the competition?
Good Luck, Liz in Austin, TX.
