- Document History
- Subscribe to RSS Feed
- Mark as New
- Mark as Read
- Bookmark
- Subscribe
- Printer Friendly Page
- Report to a Moderator
- Subscribe to RSS Feed
- Mark as New
- Mark as Read
- Bookmark
- Subscribe
- Printer Friendly Page
- Report to a Moderator
LabVIEW 2015 shipped with several new features for the Actor Framework. Not all of those features made it into the version release notes or documentation.
One such feature is Desktop Executioon Trace Toolkit (DETT) support. This new feature dramatically enhances your ability to understand and debug interactions within your actor system.
With the feature enabled, you will get a trace event whenever:
- An actor is launched
- An actor stops
- A message is sent to an actor
- An actor receives a message
- A Time Delay Message is created
- A Time Delay Message is stopped
- A Time Delay Message skips sending a copy
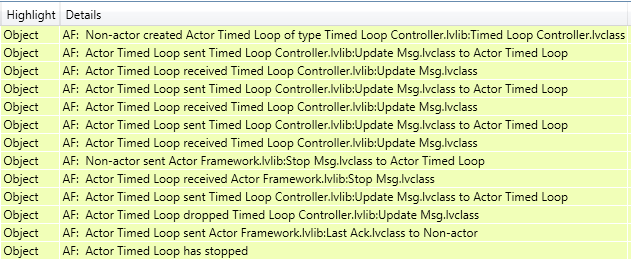
Here is a sample of trace data generated by an Actor Framework application:
To activate the feature, add the conditional disable symbol "AF_Debug_Trace" to your project, and set its value to "TRUE", as shown:
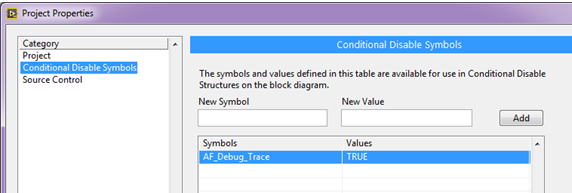
Note that the value "TRUE" is case-sensitive.
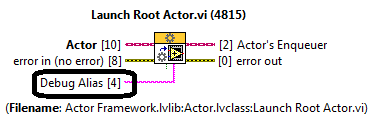
Actors and Time Delay Messages are uniquely identified by number in the trace event data, so you can see which actor was created or sent/received a message. You may also specify a debug alias for actors; if you assign an alias, it will be used to identify the actor in trace data.
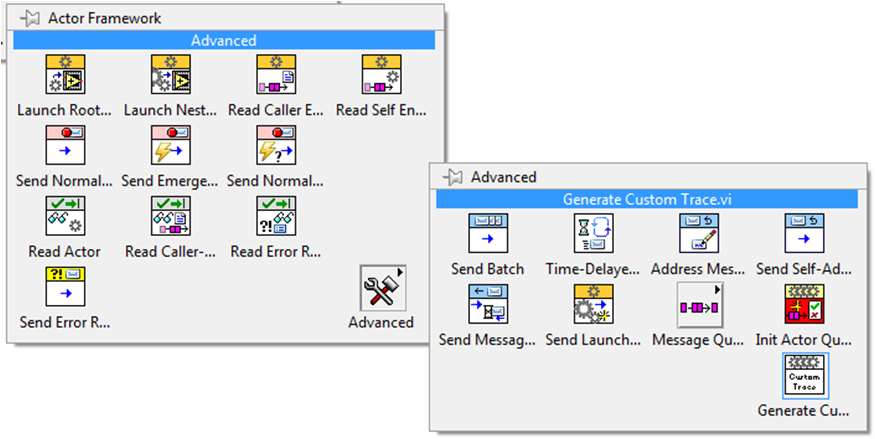
If you want to generate a custom trace containing the ID of the source actor, use Generate Custom Trace.vi, which you can find on the Actor Framework » Advanced palette.
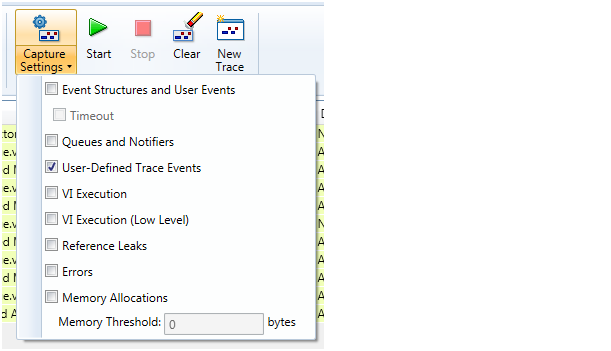
We implemented this feature using Generate User-Defined Trace Event, so be sure to enable user-defined traces in DETT:
I hope you find this new tool as useful as I have.
Enjoy!
