- Document History
- Subscribe to RSS Feed
- Mark as New
- Mark as Read
- Bookmark
- Subscribe
- Printer Friendly Page
- Report to a Moderator
- Subscribe to RSS Feed
- Mark as New
- Mark as Read
- Bookmark
- Subscribe
- Printer Friendly Page
- Report to a Moderator
How to write an ECG feature extractor with HRV analyzer using Biomedical Toolkit VIs
Introduction
LabVIEW Biomedical Toolkit provides VIs for ECG signal processing, such as feature extractor and HRV analysis. This article is to introduce how to write an ECG feature extractor with HRV analyzer using Biomedical Toolkit VIs. You can refer to LabVIEW for ECG Signal Processing and Using LabVIEW for Heart Rate Variability Analysis for more information about ECG and HRV analysis.
ECG Feature Extractor
The process of ECG feature extractor includes 4 steps:
- Acquire ECG signal from DAQ or read from file.
- Preprocess ECG signal, including filtering and rectification.
- Extract features.
- (Optional) Visualize and analyze the extraction results.
Following is a typical example for ECG feature extractor:
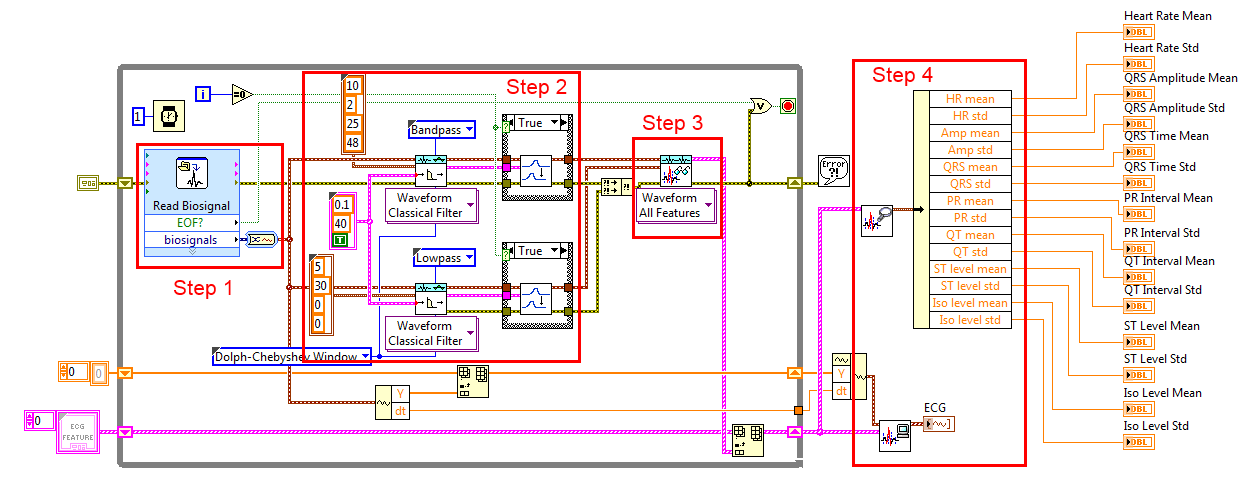
In step 1, Read Biosignal Express VI is used to read ECG signals from file. You can replace it with Biosignal DAQ Express VI if you want to acquire ECG signals from DAQ.
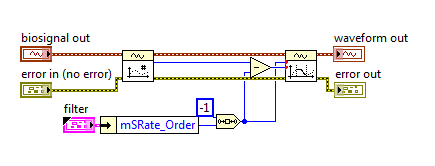
In step 2, Biosignal Filtering VIs are used to filter the ECG signal. For ECG input, use a 10-25Hz bandpass filter to make the QRS waves easier to be detected. For raw ECG input, use a lowpass filter to remove the high frequency noise in the original signal, to make the feature extraction result more accurate.
The filtering causes a latency of the ECG signal, which should be eliminated in order to keep the accuracy of extracted results. This can be simply done by discarding the first N/2 points of the first block of filtered ECG signal, where N equals to the order of the filter.
In Step 3, ECG Feature Extractor VI is used. You can choose to extract all features (including the time of P, QRS, and T waves) or only QRS waves through the polymorphic selector. When you need to extract all features, you should connect both raw ECG and ECG. raw ECG can be the original signal or slightly processed using low-pass filter (the signal amplitude should not be changed a lot).
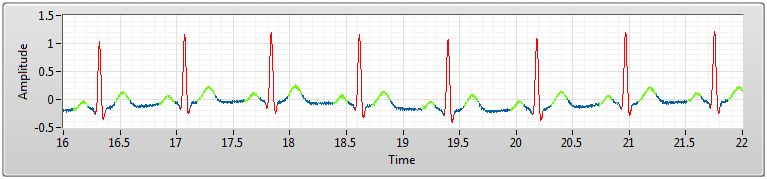
Step 4 is optional. You can visualize the extracted features like the following figure. Search “ECG Feature Extractor” in NI Example Finder for more information.
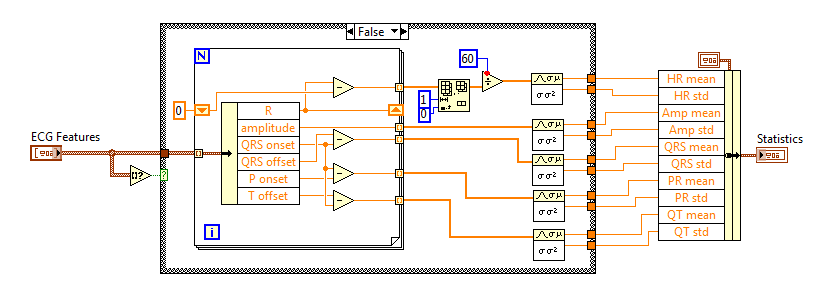
You can also analyze the statistics of extracted ECG features. Such as the mean value and standard deviation of heart rate, QRS width, etc.
HRV Analyzer
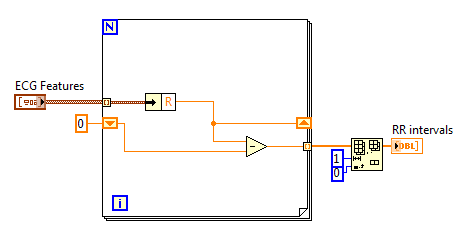
After extracting ECG features, you can analyze the heart rate variability. It is very simple to obtain the RR intervals from ECG features by subtracting adjacent R positions:
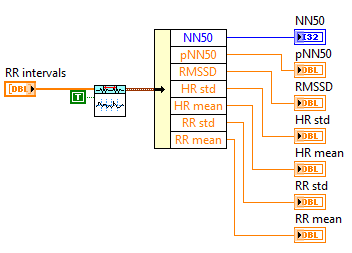
Then you can use VIs in Biomedical->Biosignal Measurement->ECG->HRV Analysis palette to analyze the RR intervals. HRV Statistics VI, HRV Histogram VI and HRV Poincare Plot VI can be directly used like:
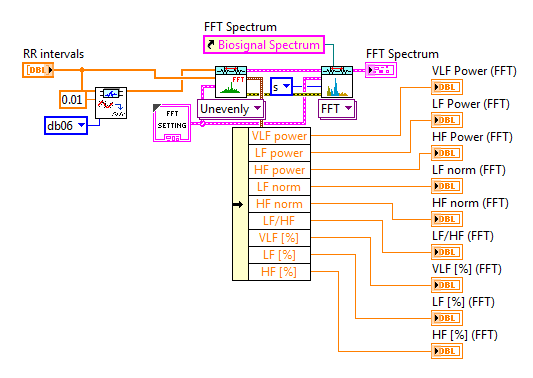
HRV FFT Spectrum VI, HRV AR Spectrum VI and HRV STFT Spectrogram VI are polymorphic VIs. Because the RR intervals obtained from the ECG features are unevenly and not re-sampled, you should choose Unevenly Sampled RR from the polymorphic selector. In this situation, raw RR and RR are both required inputs. raw RR must be the original signal and not be processed. For RR, it is recommended that you detrend the RR intervals in order to eliminate the DC components.
Following is a typical usage of HRV FFT Spectrum VI. LabVIEW Biomedical Toolkit provides a control for displaying HRV Spectrum in VLF, LF and HF bands. You can find it at Biomedical->Biosignal on the controls palette. After dropping this control, a helper VI will be generated on the block diagram, and you can connect it to HRV FFT Spectrum VI or HRV AR Spectrum VI directly as shown in the figure.
- Mark as Read
- Mark as New
- Bookmark
- Permalink
- Report to a Moderator
Hi, thank you, can you upload the example from first picture? 🙂
- Mark as Read
- Mark as New
- Bookmark
- Permalink
- Report to a Moderator
Where can i find this ?

- Mark as Read
- Mark as New
- Bookmark
- Permalink
- Report to a Moderator
So, you are not willing to share the project?
