- Subscribe to RSS Feed
- Mark Topic as New
- Mark Topic as Read
- Float this Topic for Current User
- Bookmark
- Subscribe
- Mute
- Printer Friendly Page
How to get frequency spectrum from spectrogram?
03-19-2012 11:11 PM
- Mark as New
- Bookmark
- Subscribe
- Mute
- Subscribe to RSS Feed
- Permalink
- Report to a Moderator
Hi,
i'm trying to implement some wavelet frequency analysis in EMGS signal.
i've got a scalogram (X- time, Y- scale, Z-energy) and a spectrogram (X- time, Y-frequency, Z-amplitude), as you can see in the picture (middle graph).
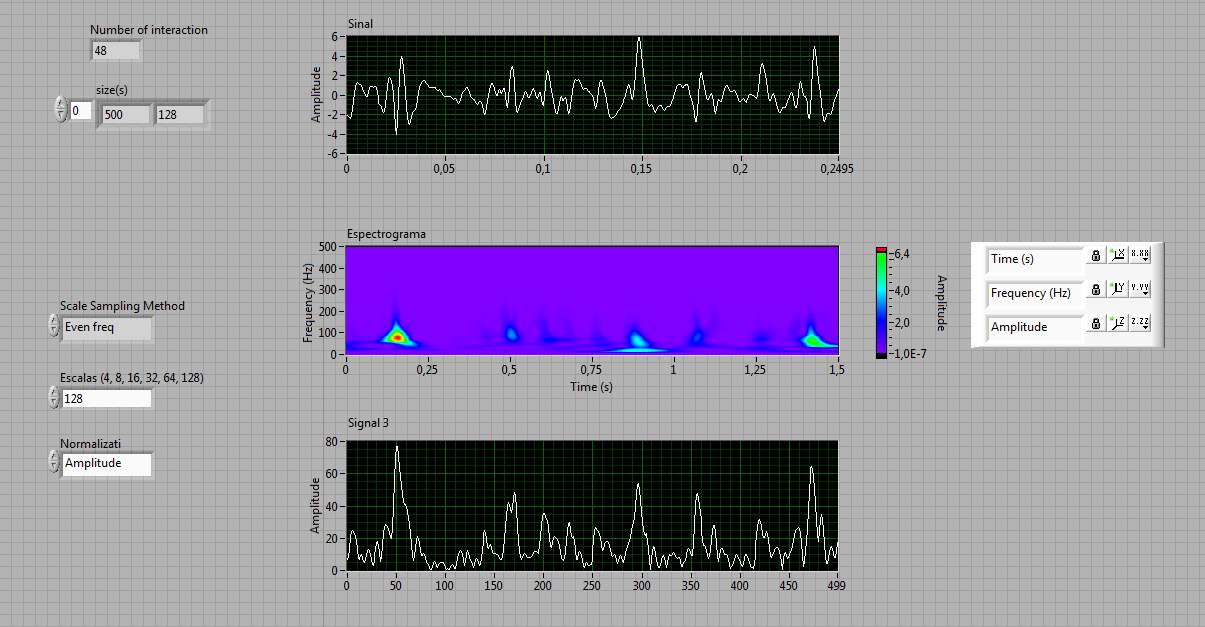
How can I "rotate" axis of the graphic, or extract the frequency spectrum to get (Y-amplitue, X- frequency).
Or yet, how to get the values of X, Y and Z axis into arrays to build a new graphic? I've tried to use some property node, but no success.
Thanks!
Ramon Campos
- Tags:
- spectrogram
- wavelet
03-20-2012 04:51 AM
- Mark as New
- Bookmark
- Subscribe
- Mute
- Subscribe to RSS Feed
- Permalink
- Report to a Moderator
Hi Ramon,
I think in the block diagram, you could find the data for displaying is just a 2D array. It is easy to right click on the plot to select "transpose".
Thanks!
ZJ Gu
03-20-2012 08:46 AM
- Mark as New
- Bookmark
- Subscribe
- Mute
- Subscribe to RSS Feed
- Permalink
- Report to a Moderator
Hi ZJ Gu,
in fact I try to transpose the graph, but it became something strange, as you can see....
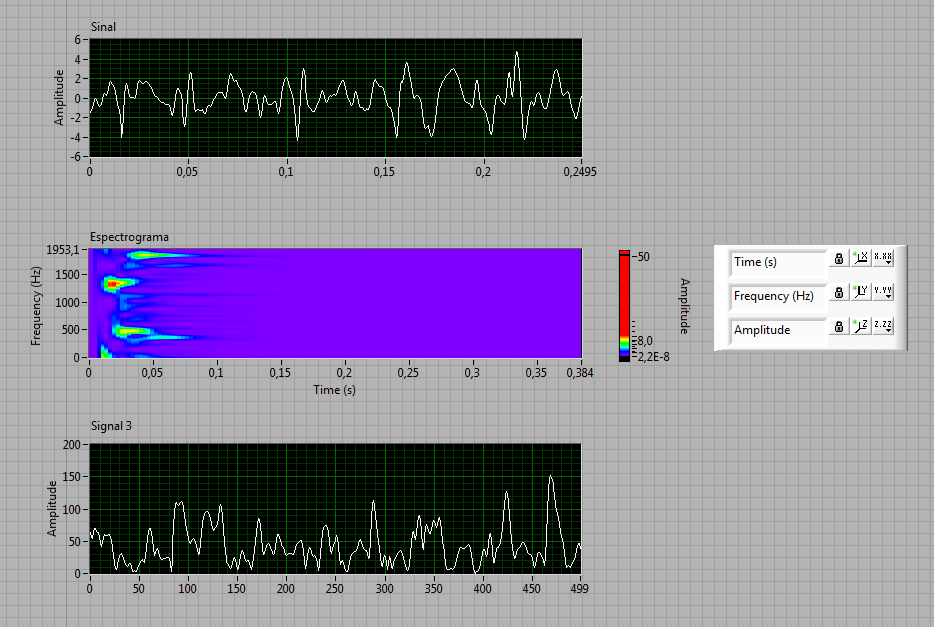
and that data don't resolve my question.....
but thank you for the tip.
I'm still trying!!
Ramon Campos
03-22-2012 09:30 PM
- Mark as New
- Bookmark
- Subscribe
- Mute
- Subscribe to RSS Feed
- Permalink
- Report to a Moderator
Hello again ZJ Gu!
after a big mess, I got some result.
but when I use low wavelets scales (4, 8, and 16) the spectrogram seems weird.
Can you please take a look at my code?
Here are the VI (lv 2010) and an EMG signal from biceps brachii in a 30 seconds isometric contraction.
Thanks!!!
