- Subscribe to RSS Feed
- Mark Topic as New
- Mark Topic as Read
- Float this Topic for Current User
- Bookmark
- Subscribe
- Mute
- Printer Friendly Page
Visualization tools for biomedical monitoring
07-02-2010 06:06 PM
- Mark as New
- Bookmark
- Subscribe
- Mute
- Subscribe to RSS Feed
- Permalink
- Report to a Moderator
We are planning to start developing superior charting toolkit for LabVIEW, based on LightningChart for .NET. We have strong biomedical background ourselves, but unfortunately we are not very experinced LabVIEW users, so it would be great if you like give comments as biomedical LabVIEW users.
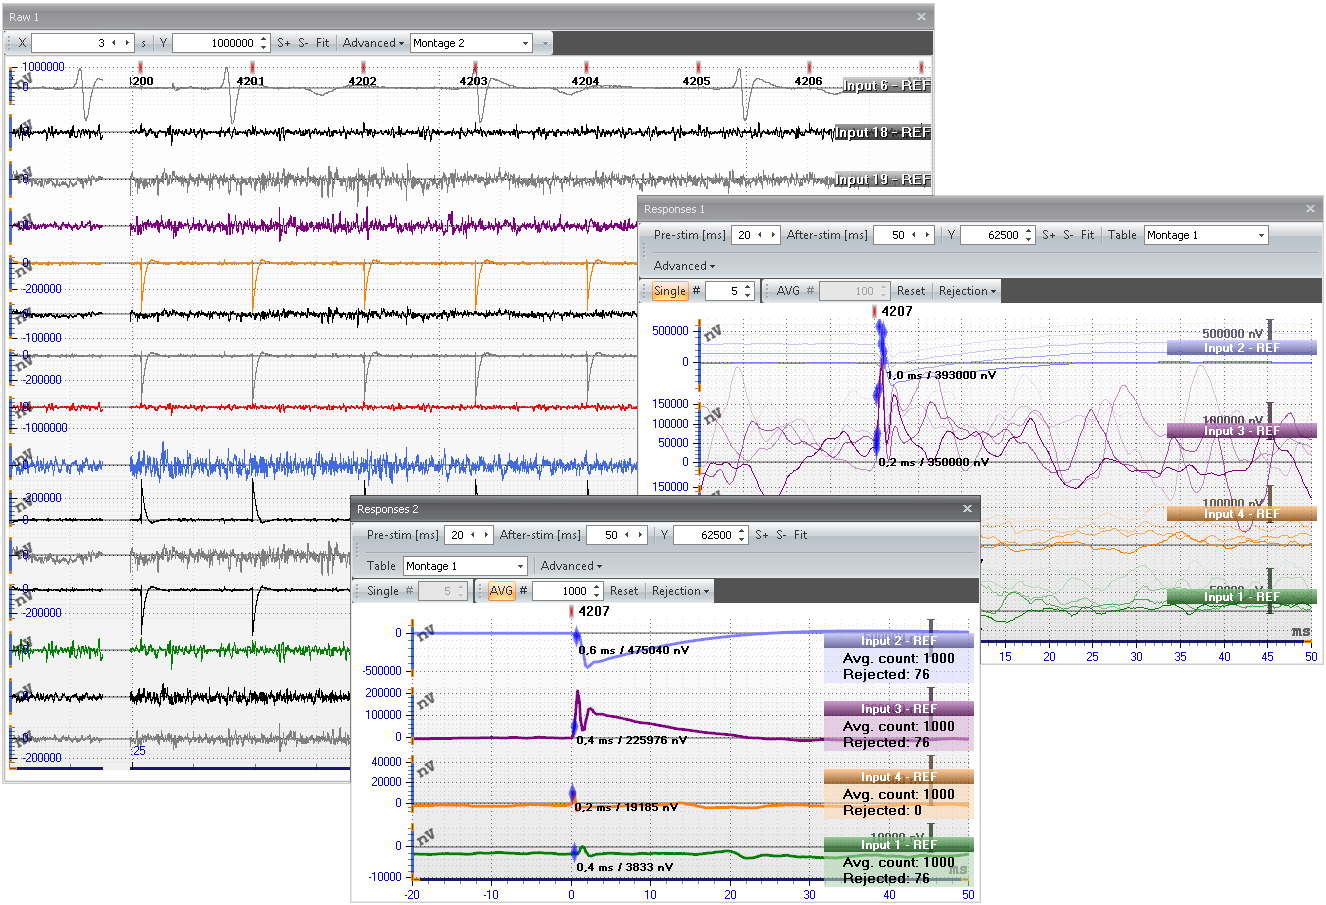
LightningChart is developed for high-speed data acquisition and signal monitoring. Some perspective of performance: it can monitor sampled signal data with 160 channels, sampling frequency is 40 kHz/channel. It does not use tricks like reducing point count by down-sampling the signal. The signal monitor windows are naturally divided into a couple of large TFT monitors.
Here's a screenshot of EEG/EMG/ECG application developed to our customer:
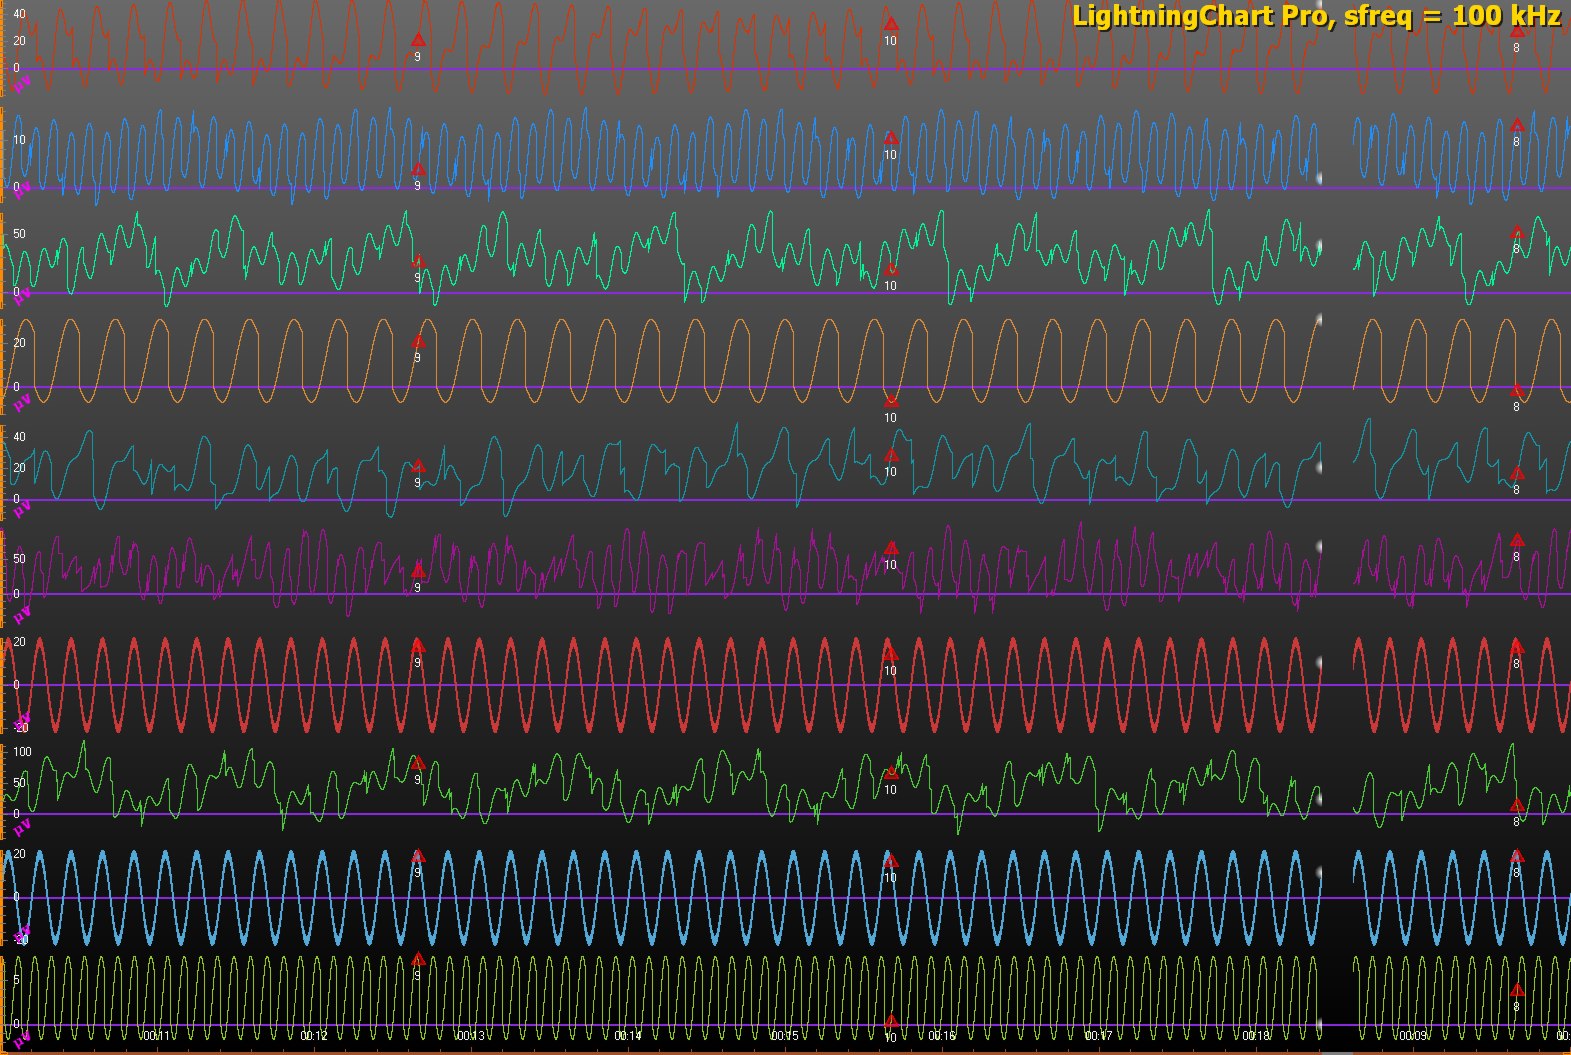
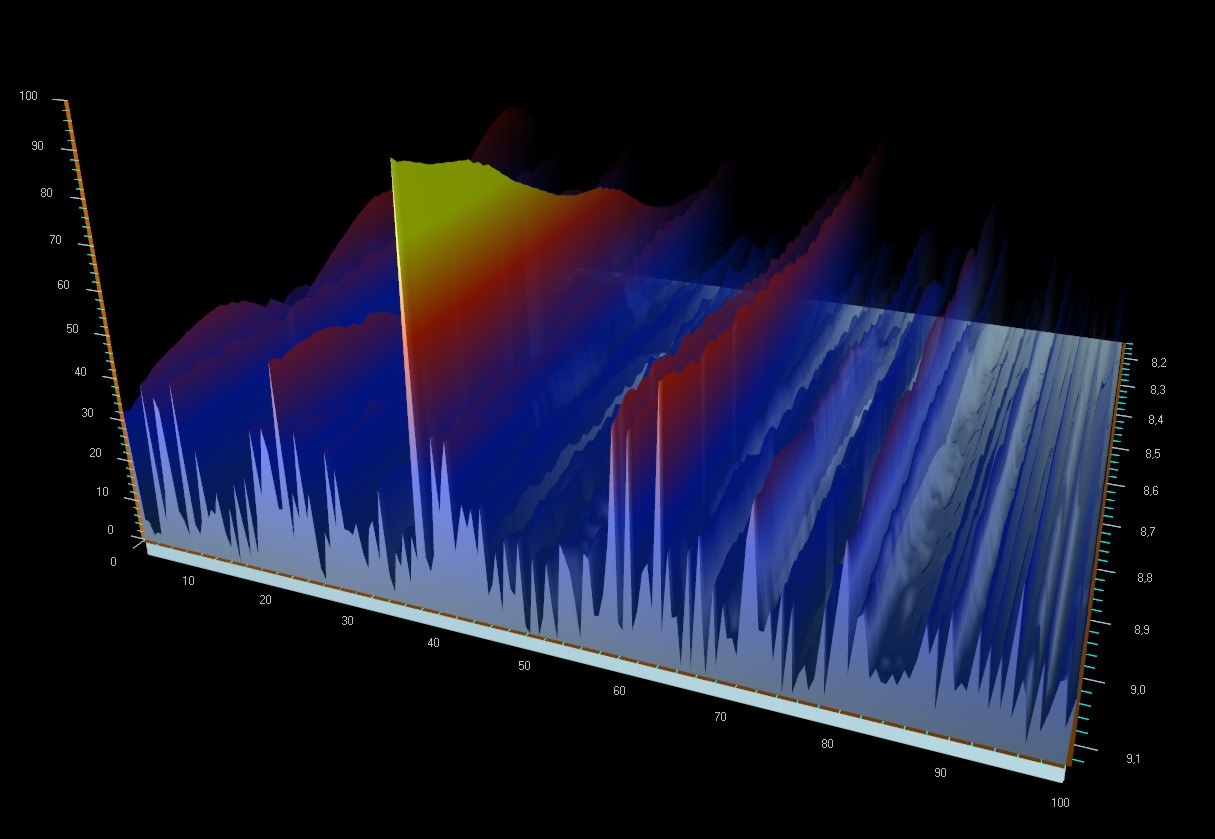
And a simple data acquisition monitor from our LightningChart 2.0 trial package with simulated signals. The other is a 3D FFT spectrum illustration with just randomly generated data.
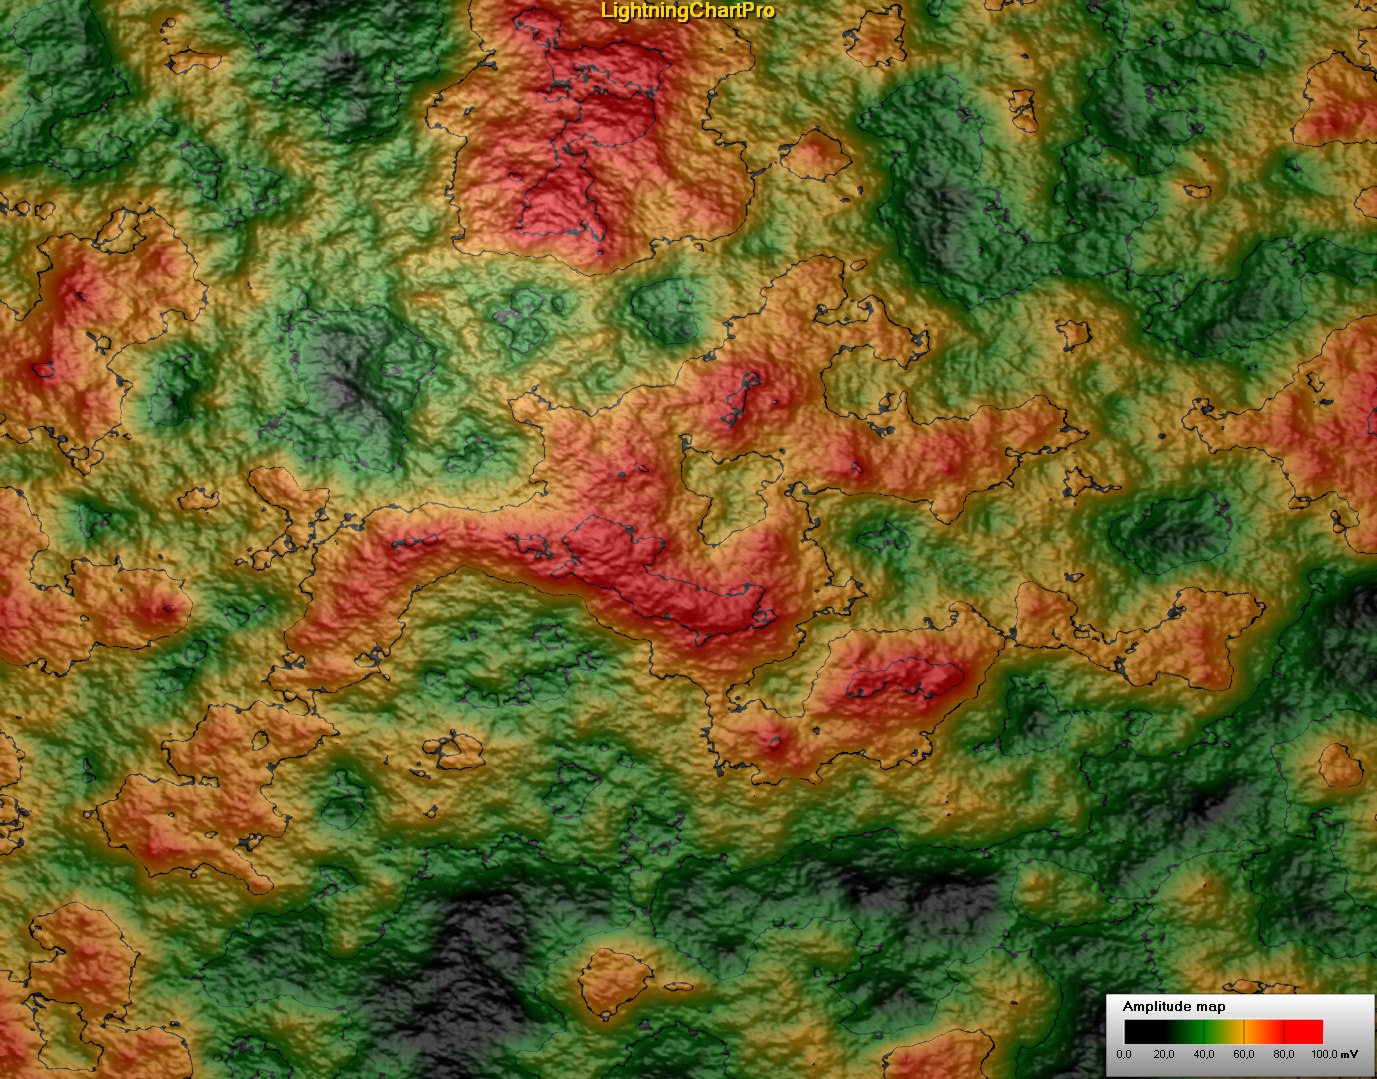
LightningChart provides powerful features for medical and bio-signal monitoring and analysis applications.
Here's a top view a amplitude-colored 3D surface:
We'd like to know what kind of visualization tools would you like to use in LabVIEW.
Other discussion is open in UI Interest Group here: http://decibel.ni.com/content/thread/7741. You are free to post comments there also.
We can't develop this kind of tools if we can't get enough feedback, so please...
For more information of LightningChart, see http://www.arction.com
07-07-2010 01:51 PM
- Mark as New
- Bookmark
- Subscribe
- Mute
- Subscribe to RSS Feed
- Permalink
- Report to a Moderator
I could have used this toolkit 10 years ago when I was working on a commercial EEG/PSG system. The LabVIEW real-time displays were fast enough (clinical EEG/PSG signals are not very high sample rates - <1Khz/channel), but the off-line browsing of large data files was marginally fast enough for rapid page flipping of 32 channels with full resolution. We would have paid good money for a high-performance charting toolkit since we were spending R&D money optimizing these parts of the application. However, I'm not sure that there are lots of applications like this out there - seems to me that the bulk of our biomedical users, which are not commercial OEMs, are content with the visualization capabilities (both real-time and offline review) except in special situations (very high sample rates and high channel counts, etc.).
Good luck!
