- Document History
- Subscribe to RSS Feed
- Mark as New
- Mark as Read
- Bookmark
- Subscribe
- Printer Friendly Page
- Report to a Moderator
- Subscribe to RSS Feed
- Mark as New
- Mark as Read
- Bookmark
- Subscribe
- Printer Friendly Page
- Report to a Moderator
Ship Shake: Which Shipping Company is Nicest to Your Stuff
It Has Happened to Everyone
In college, I bought my dad a World's Fair Beer clock from eBay. It was a nice clock with a glass case on the side to display all 7 colors of World's Fair Beer cans from the 1982 World's Fair in Knoxville, TN. My dad had never seen one of these clocks even though he was actually the inventor of the beer, so it was a cool gift for him. If you follow the blog you should understand that this is different than the antique clock controller I made for him on Father's Day.

My dad holding up a prototype can of his invention before the 1982 World's Fair
Anyway, upon recieving this fairly fragile decorative piece, I discovered the eBay seller actually included 7 beer cans (one of each color) still full from 20 years before! This is even more funny considering there are cases upon cases of every color in my parent's basement. Of course, one of the cans had busted in route. The poorly packed parcel arrived smelling like a bag of 20 year old lake water and the busted can had a big dent in the side adjacent to a sizable hole. Everyone has had it happen...a package arrives, and you can tell by the damaged box that the contents are broken.
With so many examples like this one, Jamie Brettle and I teamed up with Glen Derene the Senior Tech editor in Popular Mechanics to see exactly what happened to that beer can irrespective of the hindsight that says dont ship a 20-year-old beer wrapped in one piece of newspaper. We wanted to understand exactly what a shipped package endures on it's journey from point A to point B. To do this, we used a TI Evaluation board, an Analog Devices MEMS accelerometer, an Energizer Battery, and programmed an acceleration datalogger using LabVIEW.
The Article
Popular Mechanics ran this article in the print edition of the December issue. Here is the web version of that article.
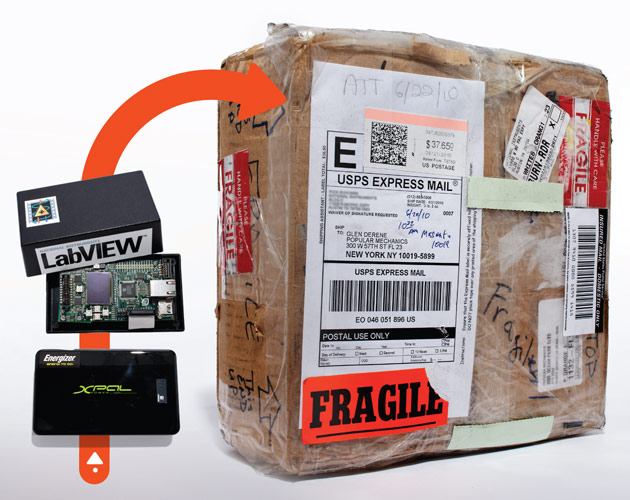
This is the package we used, with an image of the datalogger we made
Here is me discussing the project on Local Austin News:
http://www.kxan.com/dpp/news/consumers/shipping-companies-put-to-the-test
The article spawned a flurry of news which was carried on ABC and CBS Nightly news as well as Good Morning America, CBS Morning Show, and Good Day New York. Here are just a few of the videos from those shows.
http://www.cbsnews.com/stories/2010/11/30/earlyshow/living/parenting/main7102605.shtml?tag=cbsnewsTw...
http://www.myfoxny.com/dpp/good_day_ny/shipping-tips-20101201
The System
We started this project with the goal to characterize and log the accelerations of shaking, dropping, and general jostling in a small battery powered device that would stay alive for at least three days. The plan was to put this device in a box, ship it around the country, and see what happened. We achieved these goals (and then some) and here is how we did it.
Considerations
- Battery Life - The number one difficult issue with this system is the requirement to do high speed datalogging for at least three days on a battery. You might be thinking "it sounds simple enough... my phone can last three days and it is doing a lot more than simple datalogging." Actually...your phone can last that long, because it has sophisticated standby and power saving modes. We needed an acquisition system that logs acceleration constantly with thousands of samples per second in order to "catch" every drop or spike in the data. It is more analogous to playing "Angry Birds" for three days straight. Unfortunately, a typical "Angry Birds" bender can only last around 6 or 7 hours on a typical phone battery because of the processing involved. The next thing you are undoubtedly thinking is "well then... can't you just use a bigger battery." To that I say yes, but to a point. Shipping a hybrid car battery around the country is not exactly practical or cost effective. The challenge was to lower the power of our acquisition system to a point where a practically large battery would work, and stay within the constraints of what we had readily available.
- Acceleration Measurement - Acceleration is not a trivial signal to acquire. Transducers for acceleration, vibration, and shock are usually mechanical and require excitation signals. Getting a good acceleration measurement is power hungry because of the dynamic nature of the signal and the measurement techniques. The lowest power method of reasonably accurate acceleration measurements is using MEMS sensors. MEMS stands for Microelectromechanical Systems and here is an great description of how they work. This is the technology used to detect movement in a smart phone or Wii Controller.
- Logging - At thousands of samples per second over multiple days, we are talking about a lot of data. It was apparent that we were going to need to write to an external storage device, and chose microSD. This is the exact type of storage device that stores the photos in many modern digital cameras.
Accelerometer Sensor Details
We chose a MEMS accelerometer from analog devices (ADI), that had many desirable features for our project. The exact chip was the ADIS16240. The main features of this chip we needed are:
- Reasonably high measurement range - +/-19G
- Low Power Modes - Obviously
- Tri-Axis - Measurement in the X,Y, and Z direction
- Peak Sample and Hold Registers - This was perfect because we were only interested in the peak acceleration in a given time interval for us it was every second.
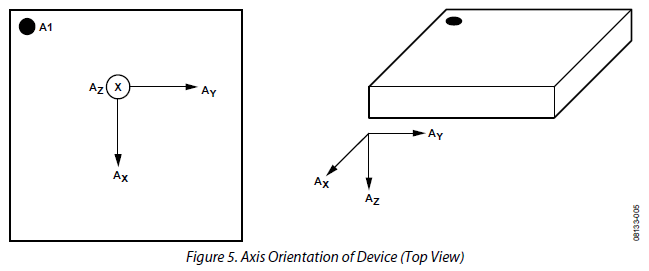
Chip axis representation. The vectors show the direction of each measurement.
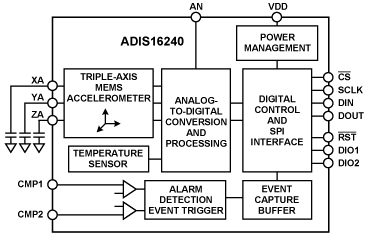
Chip Functional Block Diagram
Internally the chip takes acceleration samples 1600 times a second, and storing the peak value during that time period in a register. Each second we wake the processor and it reads that register, giving us one data point in the X,Y, Z and a temperature point.
The Software
We used LabVIEW to create a program to run on the ARM processpor board. The main job of the software was to initialize the chip and then go immediately to sleep. Every second the processor wakes up, reads the peak registers, and goes back to sleep. Every few minutes the software did a batch transfer to a text file on the microSD Card. The buffered operation saved power by not writing to the SD after every sample. The accelerometer communicates using Serial Peripheral Interface (SPI), which is an industry-standard embedded protocol. We were able to use built-in VI for SPI in LabVIEW for ARM. There are also built in VIs to log to the microSD card. We used an inline C Node to call the chip sleep functions. We used a bunch of normal LabVIEW programming blocks to decode the bits from the chip and scale them correctly to get the correct units of G and Temperature. Here is screen shot of the heart of the acquisition and initialization of the accelerometer.
.png)
This is a test VI that sets all of the registers on the sensor, takes a reading, scales the reading, and creates a full line string for the text file including sample index, X, Y, Z, and Temp
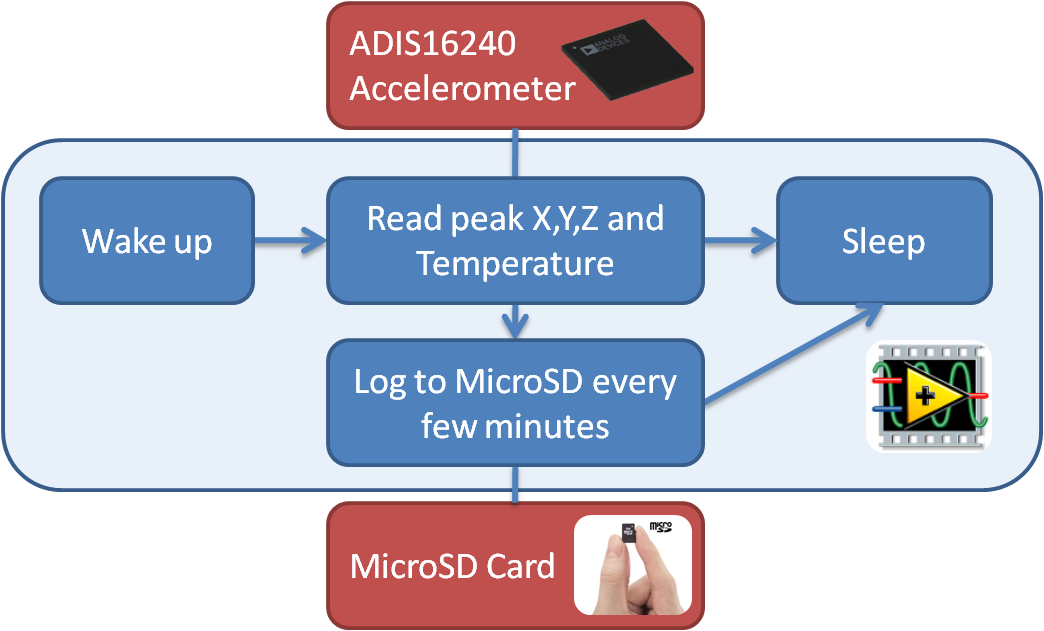
This is a block diagram of what the code is doing
The Results
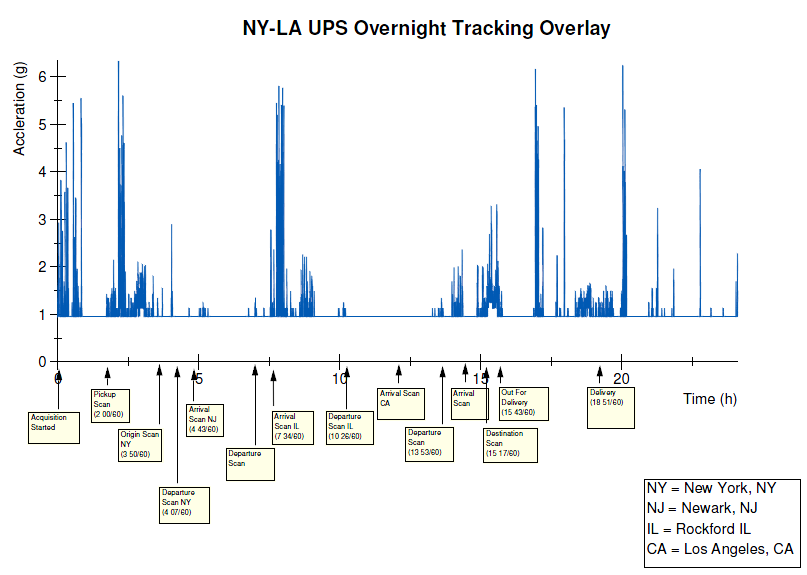
Our final data files were large many of them had over 200,000 samples representing every second for 3 days. With the results we wanted to show a single graph of the acceleration the package experienced. Using the three directions of acceleration you can calculate the vector magnitude of the resultant to get one magnitude of acceleration.
We were also able to using the shipping information and tracking number to get a couple of time stamps of where the package was in the trip. For example the tracking number shows that at 5:23PM the package arrived at an Austin, TX sorting facility. Knowing the start time and the sampling rate of our data we can plot the timestamp of the graph. A typical data set looked like this (analyzed in Diadem by our third partner Kelley Rink).
It is obvious why I recieved a beer-stained gift for my dad. Everyone has thier own horror story but it is interesting to see what exactly happens along the way.
