Overview
This example shows how a string identifier can be added prefixed to the value displayed in the digital display of waveform charts
Description
The digital display for waveform charts do not have a label or any form of identifier to associate them with the plot whose value they represent.This can become a problem when there are multiple plots in your waveform chart especially because the location of these digital displays in the front panel can be changed.
To get around this problem, a string identifier can be prefixed before the values for each digital display. The code in this example demonstrates how this can be done within a while loop.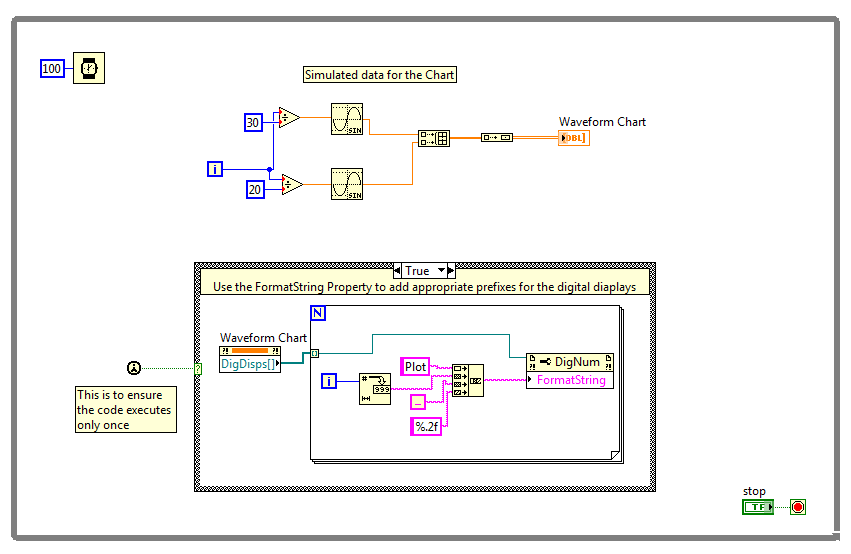
Requirements
Software
LabVIEW 2013
Hardware
NA
Additional Images or Video