Overview
The example code listed below demonstrates how to plot sampled data on an XY-graph and simulate the behavior of an XY-chart.
Description
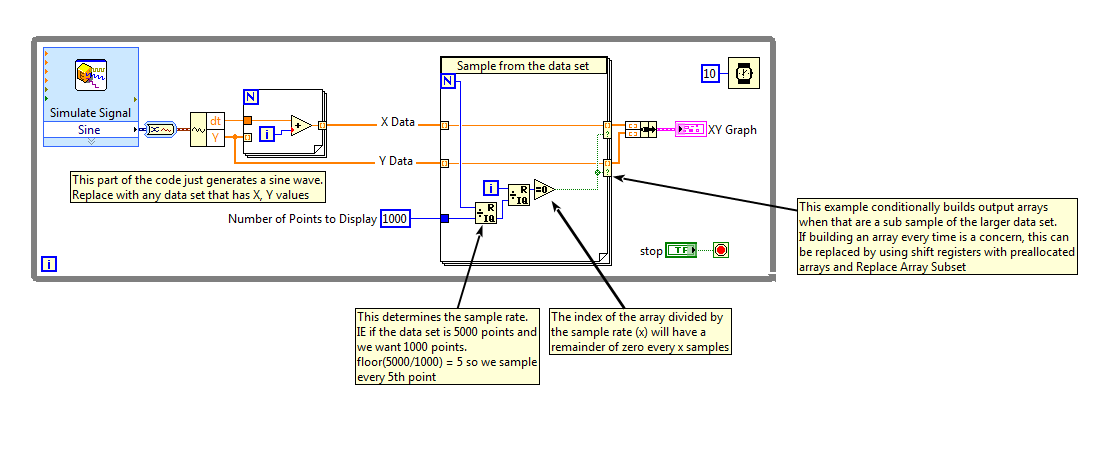
In the attached VI, data is sampled within a for-loop, stored within a conditional for-loop, and plotted on an XY-graph.
Requirements
- LabVIEW 2012 (or compatible).
Steps to Implement or Execute Code
- Download the attached VI.
- Replace Simulated Signal with your own data.
- Run the VI.
**This document has been updated to meet the current required format for the NI Code Exchange.**
