Creating 3D Surface Graphs and 3D Parametric Graphs Using Cylindrical Coordinates Using LabVIEW
- Subscribe to RSS Feed
- Mark as New
- Mark as Read
- Bookmark
- Subscribe
- Printer Friendly Page
- Report to a Moderator
Products and Environment
This section reflects the products and operating system used to create the example.To download NI software, including the products shown below, visit ni.com/downloads.
- LabVIEW
Software
Code and Documents
Attachment
Overview
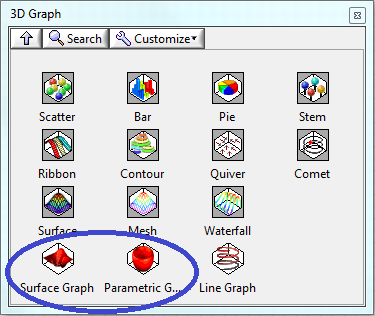
The example shows how to use 3D Graph Palette on the Front Panel in LabVIEW to create a 3D Surface Graph or a 3D Parametric Graph.
Description
The example shows how to use 3D Graph Palette on the Front Panel in LabVIEW to create a 3D Surface Graph or a 3D Parametric Graph. You can use the create plot VI's to input 1D or 2D arrays to define the plots. Using a Property Node, you can change to a Cylindrical Coordinate System.
Requirements
- LabVIEW 2012( (or compatible)
Steps to Implement or Execute Code
- Change the vector in front panel
- Run the vi
Additional Information or References
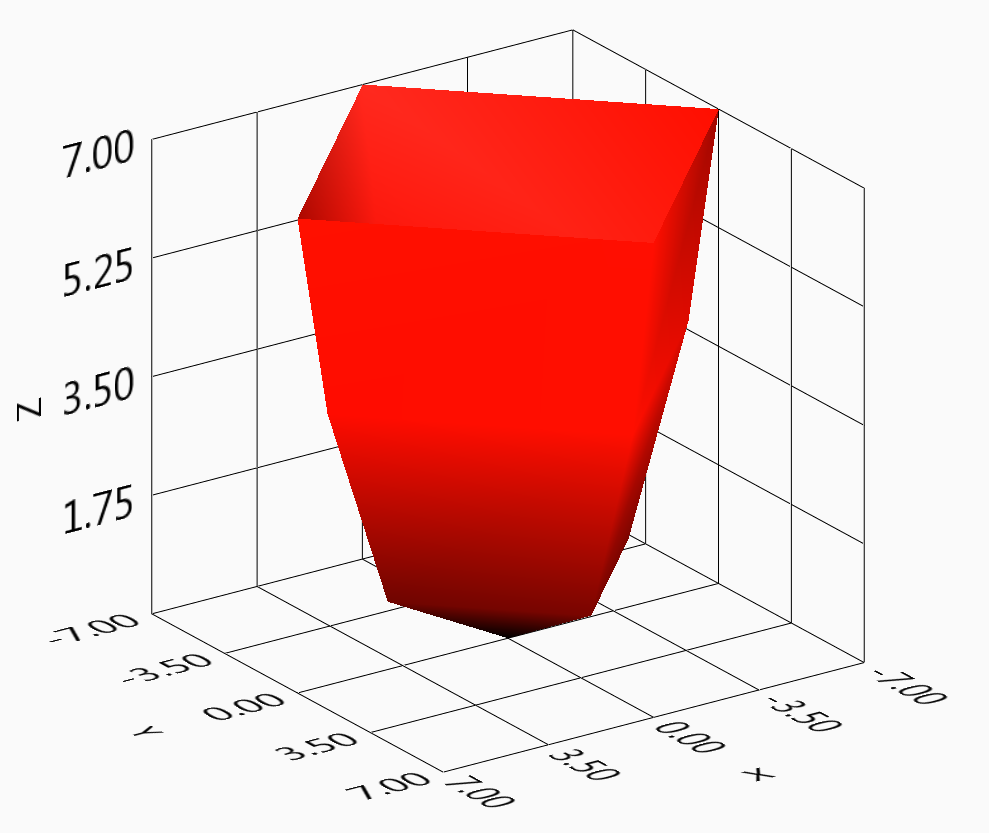
In either case (3D Surface Graph or 3D Parametric Graph), we have:
- The z-matrix represents the radial distance "r"
- The x-vector or x-matrix represents the angle "theta" (in radians) and
- The y-vector or y-matrix represents the height "z"
The 3D Surface Graph may only be used if the radial distance r is the only dependent variable. This is because the theta and z values are represented only by vectors.
The 3d Parametric Graph must be used if you wish to vary theta or z as dependent variables. Following the general format provided in the attached VI, you can create any cylindrical 3D plot.
**This document has been updated to meet the current required format for the NI Code Exchange.**
Applications Engineer
National Instruments
Example code from the Example Code Exchange in the NI Community is licensed with the MIT license.
- Mark as Read
- Mark as New
- Bookmark
- Permalink
- Report to a Moderator
The problem with this solution is that the color change of surface plot is a function of distance from XY origin. What I need is for the color change to be function of offset from the z-axis origin. I have tried every 3D Graph Property and can not seem to get the desired result.
- Mark as Read
- Mark as New
- Bookmark
- Permalink
- Report to a Moderator
Hi,
Thanks a lot for the tutorial. I am really in need of this. Can you update the file release to LabVIEW 2009? All files are for 2012!
- Mark as Read
- Mark as New
- Bookmark
- Permalink
- Report to a Moderator
hI, i'm wondering how did you form the 2D matrix from the X and Y vector?
- Mark as Read
- Mark as New
- Bookmark
- Permalink
- Report to a Moderator
I want export to file 3d: ASE, STL or VRML. Can you help me?
