Stack an Arbitrary Number of Plots on a Chart
- Subscribe to RSS Feed
- Mark as New
- Mark as Read
- Bookmark
- Subscribe
- Printer Friendly Page
- Report to a Moderator
Code and Documents
Attachment
If you show the VI Scripting Methods and Properties from the Options menu in LabVIEW, you'll have the Waveform Chart property nodes needed to stack plots programmatically. Since you can't toggle the Stack Plots property during run time, use a helper VI to toggle the Stack Plots property of a chart in an Idle VI. After you set the properties of the chart, run the VI.
One quirky thing I ran into was for the chart to adapt to a different number of waveforms between runs, I had to toggle the Stack Plots property off, set the number of visible items in the chart legend to match the new number of waveforms, then toggle the Stack Plots property back on. If you like, you can then hide the legend, but the number of plot areas within the chart always corresponds to the number of visible items in the legend when the Stack Plots property is toggled on. If you send more waveforms to the chart indicator than there are plot areas for, the last plot area overlays the extra traces.
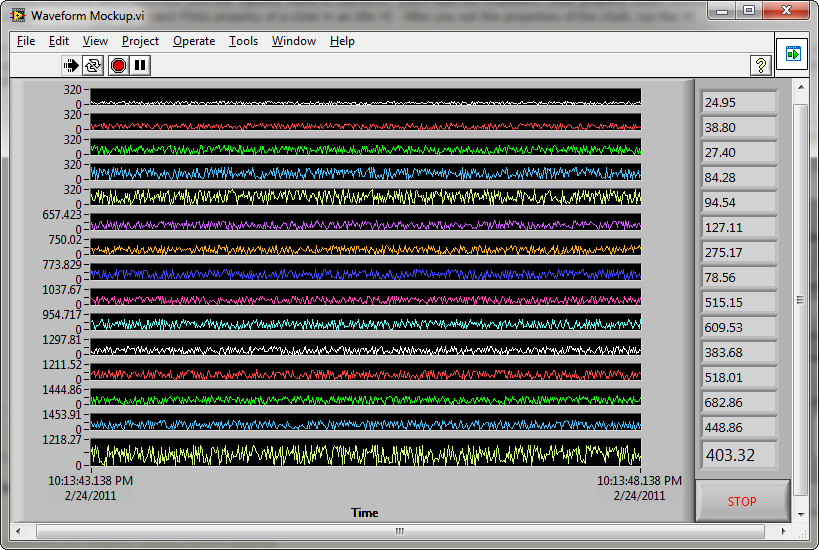
I used a private property to line up each digital display with the plot area, and you can find information about that on Lava if you need it.
Example code from the Example Code Exchange in the NI Community is licensed with the MIT license.
- Mark as Read
- Mark as New
- Bookmark
- Permalink
- Report to a Moderator
As a caveat, VI scripting methods are unavailable in the runtime engine. If you build a LabVIEW EXE with enhanced DSC support and debugging enabled, the EXE can use the scripting node. You should understand the caveats of the DSC RTE before you use it.
- Mark as Read
- Mark as New
- Bookmark
- Permalink
- Report to a Moderator
Is this still true about VI Scripting? Just want to confirm that VI scripting CAN NOT be used in built executable.
- Mark as Read
- Mark as New
- Bookmark
- Permalink
- Report to a Moderator
Old I know but I just found this. In general you cannot use VI Scripting in an EXE. Some scripting allows for making VIs from scratch and saving them, and if that could be done the run time engine would be as big as a LabVIEW install. Some functions however do work, you can open them and look at the help which will state if it isavailable in the Run-Time or not, in this case you cannot use this in an EXE because of the Stack Plots property that is read only in an EXE.
Unofficial Forum Rules and Guidelines
Get going with G! - LabVIEW Wiki.
16 Part Blog on Automotive CAN bus. - Hooovahh - LabVIEW Overlord
