- Subscribe to RSS Feed
- Mark Topic as New
- Mark Topic as Read
- Float this Topic for Current User
- Bookmark
- Subscribe
- Mute
- Printer Friendly Page
Oscilloscope
06-13-2013 04:18 PM
- Mark as New
- Bookmark
- Subscribe
- Mute
- Subscribe to RSS Feed
- Permalink
- Report to a Moderator
Hi, i need to create a oscilloscope.vi that reads the electrical sinal from mine Arduino Uno.
What's the easier way to do that?
Thanks
06-14-2013 12:32 AM
- Mark as New
- Bookmark
- Subscribe
- Mute
- Subscribe to RSS Feed
- Permalink
- Report to a Moderator
That depends on what kind of functionality you need. Explain in detail exactly what you are trying to do.
06-14-2013 12:54 PM
- Mark as New
- Bookmark
- Subscribe
- Mute
- Subscribe to RSS Feed
- Permalink
- Report to a Moderator
LIFA is not suitable fror simulating an oscilliscope. The data acquistion rate is to low. The maximum rate at which you can acquire an analog signal is approximately 400 to 500 eamples per second. The maximum frequency you can monitor is approximately 1/10 of the sampling rate.
hrh1818
06-15-2013 11:00 AM
- Mark as New
- Bookmark
- Subscribe
- Mute
- Subscribe to RSS Feed
- Permalink
- Report to a Moderator
Hi, i need to create something like this:
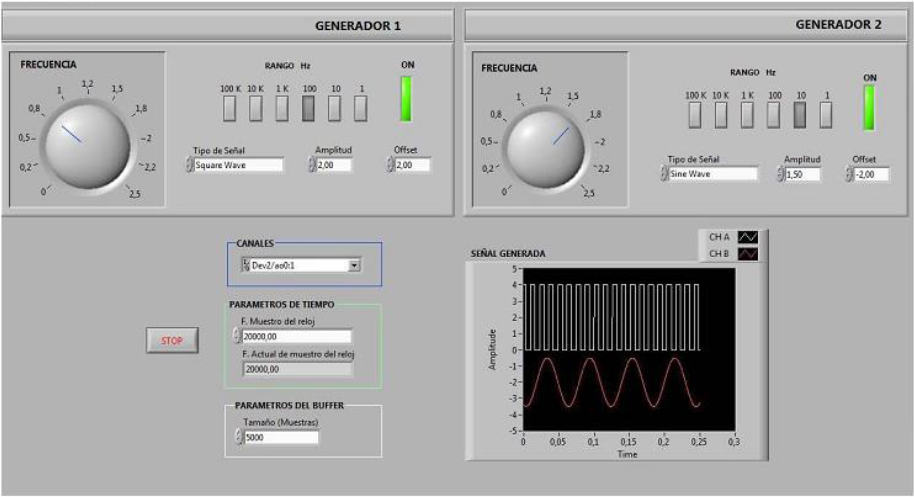
I will connect a extensometer to the arduino (it will read the weight), and then i must dislpay the waves in Labview (Oscilloscope)
Thanks for the help.
06-15-2013 02:13 PM
- Mark as New
- Bookmark
- Subscribe
- Mute
- Subscribe to RSS Feed
- Permalink
- Report to a Moderator
Like hrh1818 said, you will not be able to get the full functionality of an oscilloscope (and likely far from it). Also, in my experience, an extensometer would not be read by an oscilloscope because it should be just a single increase in voltage (and not a wave).
So, for this, I would think you would be able to use the "continuous acquisition" function. However, you won't be able to sync or even obtain another analog signal at the same time.
If you give more details of the overall system you are trying to create and all of the signals that you are hoping to acquire, we might be able to help you better.
06-16-2013 11:36 AM
- Mark as New
- Bookmark
- Subscribe
- Mute
- Subscribe to RSS Feed
- Permalink
- Report to a Moderator
An extensometer is normally uesd to measure the change in length of an object. What is the relationship between change in length and weight in your experiment? What is producing the waves you want to display? What is the relationship between weight and waves in your experiment? What is the frequency of the waves?
Have you tried usng ARduino to digize your signal and a Labview Chart Recorder to display your signal?
hrh1818
06-19-2013 04:18 PM
- Mark as New
- Bookmark
- Subscribe
- Mute
- Subscribe to RSS Feed
- Permalink
- Report to a Moderator
Ok, i will try to explain, this is a project for the school.
The goal is to implement a simple system of data acquisition based on arduino card. The system intends to make it possible to connect a 120Ω gage with a variation of plus or minus 2% of its strength at rest in order to simulate a weighing system. This change will make a weighing with a range of 0-100kg in a linear fashion (120 +2% = 100kg).
Requirements Implementation:
Mounting of a bridge of wheatstone, extensometer an the amplification of the sinal to be able to read it, and to reduce noise...
The value that I have read in Labview is the variation that will occur on the extensometer. I don't yet de frquency of the waves.
I hope it was more explicit.
I am thinking to using Waveform Graphs,but will be better to use Chart Recorder?
Thanks for the help!
