- Subscribe to RSS Feed
- Mark Topic as New
- Mark Topic as Read
- Float this Topic for Current User
- Bookmark
- Subscribe
- Mute
- Printer Friendly Page
How to place a Reference Plot inside Acquired Data Graph?
07-21-2008 01:56 PM
- Mark as New
- Bookmark
- Subscribe
- Mute
- Subscribe to RSS Feed
- Permalink
- Report to a Moderator
I'm trying to set up the driver for an HP 4396a to display a set reference plot alongside an acquired data plot (From HP 4396a) inside of the same graph. So one plot that is always there and one plot that shows data retrieved from the Network Analyzer. I have tried using the "Read from Measurement File", but with no luck. Hopefully in the end I can have those two plots, along with the cursor legend on the acquired data plot and two constant Y value lines for reference.
Thanks
Mike
07-21-2008 02:05 PM
- Mark as New
- Bookmark
- Subscribe
- Mute
- Subscribe to RSS Feed
- Permalink
- Report to a Moderator
i don´t know the device, but i think you can receive the data from it and plot it with the other data into one graph. How do you do it at the moment?
Mike
07-21-2008 02:15 PM
- Mark as New
- Bookmark
- Subscribe
- Mute
- Subscribe to RSS Feed
- Permalink
- Report to a Moderator
07-21-2008 02:20 PM
- Mark as New
- Bookmark
- Subscribe
- Mute
- Subscribe to RSS Feed
- Permalink
- Report to a Moderator
Thanks
Mike
07-21-2008 02:25 PM
- Mark as New
- Bookmark
- Subscribe
- Mute
- Subscribe to RSS Feed
- Permalink
- Report to a Moderator
07-21-2008 02:49 PM - edited 07-21-2008 02:58 PM
- Mark as New
- Bookmark
- Subscribe
- Mute
- Subscribe to RSS Feed
- Permalink
- Report to a Moderator
The next step I'm trying to get to is a plot on that same graph for somebody to look at and see if the plot acquired from the 4396a matches closely enough to pass. The attached .llb is where I am at with the superimposed plot, but I need for that superimposed plot to be a previously retrieved plot. The bottom graph is my attempt at the .lvm Read from Meas.
Sorry and Thanks
Mike
EDIT: Now that I see it, with the graph superimposed on top the cursors are no longer accessible which is a slight problem. So the better way is to get it to display on the graph, but still get the cursors to follow the acquired data and have the "Store Data" only save the acquired
Message Edited by Mike415 on 07-21-2008 12:58 PM
07-21-2008 03:14 PM
- Mark as New
- Bookmark
- Subscribe
- Mute
- Subscribe to RSS Feed
- Permalink
- Report to a Moderator
There is no Read From Measurement File in the top level VI that you posted. I'm having a hard time telling what is going on in the program. You could simply it considerably by using an event structure on the block diagram and I think a tab cotnrol on the front would make some sense as well. You really need to cut down on the local variables as well.
In any case, what you are using is actually an XY graph. The X array and Y array are bundled together. In order to add another plot, I think you will need to keep this in a shift register and in the case/event where you read from file, build a new x array and y array from the file and add this plot by using a Build Array function on the shift register data.
It also looks like you have a completely custom file format. Since this VI does not use the Write to Measurement File, you will need a custom file read in order to get the correct data.
07-21-2008 03:18 PM - edited 07-21-2008 03:21 PM
- Mark as New
- Bookmark
- Subscribe
- Mute
- Subscribe to RSS Feed
- Permalink
- Report to a Moderator
The .llb I posted was a downloaded driver that I just changed a very small amount
Message Edited by Mike415 on 07-21-2008 01:21 PM
07-21-2008 03:35 PM - edited 07-21-2008 03:36 PM
- Mark as New
- Bookmark
- Subscribe
- Mute
- Subscribe to RSS Feed
- Permalink
- Report to a Moderator
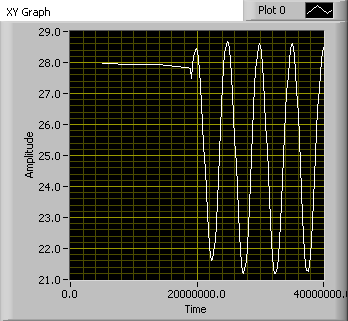
What is that data supposed to represent? If I use an XY Graph like you have in your program, I see the plot below.
Message Edited by Dennis Knutson on 07-21-2008 02:36 PM
07-21-2008 03:49 PM
- Mark as New
- Bookmark
- Subscribe
- Mute
- Subscribe to RSS Feed
- Permalink
- Report to a Moderator
