- Subscribe to RSS Feed
- Mark Topic as New
- Mark Topic as Read
- Float this Topic for Current User
- Bookmark
- Subscribe
- Mute
- Printer Friendly Page
debugging shared library (so) with eclipse on myrio
09-19-2014 04:45 AM
- Mark as New
- Bookmark
- Subscribe
- Mute
- Subscribe to RSS Feed
- Permalink
- Report to a Moderator
Has anybody experience with debugging shared library files in eclipse?
I don´t get it running!
I will explain a little bit more......
I want to debug (with setting Breakpoints) a shared obefect file in Eclipse. For convenience I created a very simple C File:

This is the dedicated project tree with the succesfully created so-file:

I copied the created so-file to the MyRIO device with the remote system Explorer to the following location: \usr\local\lib
Also I copied the whole \usr from the myrio to my Host-PC and add the path to the. gdbinit file.

Next I have make a power-cycle from the myRIO device. After that I can sucessfully include the .so file in Labview. This works all great to this point:

But I want more.....I want debug the c-file in Eclipse and follow the NI tutorial: http://www.ni.com/tutorial/14690/en/
I have set up the debugger like explained in the tutorial:


But if I debug I get this window with several errors:

Hope someone can help me to get it running!
Many thanks!
Holger
09-19-2014 06:03 AM
- Mark as New
- Bookmark
- Subscribe
- Mute
- Subscribe to RSS Feed
- Permalink
- Report to a Moderator
For me worked following:
gdbserver localhost:2345 --attach $(pidof lvrt)
CLA, CTA, CLED
09-19-2014 06:23 AM
- Mark as New
- Bookmark
- Subscribe
- Mute
- Subscribe to RSS Feed
- Permalink
- Report to a Moderator
Hi Jiří,
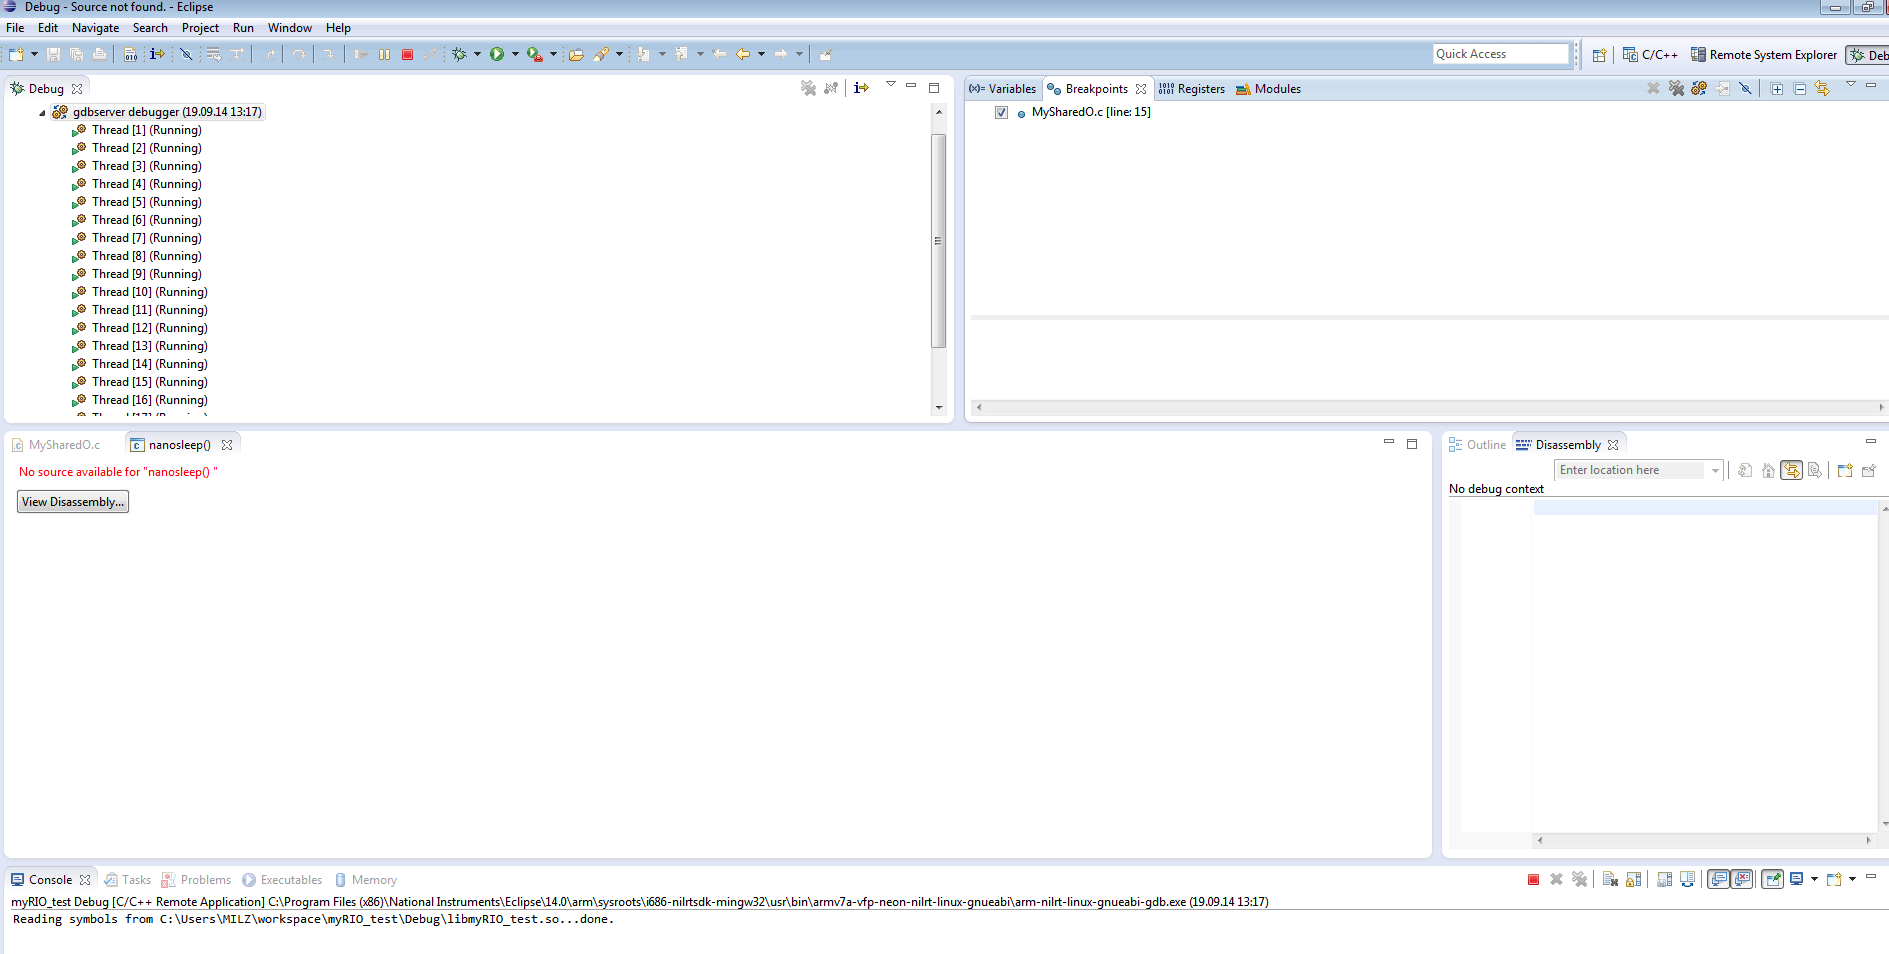
thx for the fast reply! I have change the gdbserver command-line and it looks better. But unfortunately I have the next error message: No source available for "nanosleep()"
See Image:
Hope you can fix it too? ;-)))
THX
Holger
09-19-2014 06:28 AM
- Mark as New
- Bookmark
- Subscribe
- Mute
- Subscribe to RSS Feed
- Permalink
- Report to a Moderator
The configuration, that I was using was for LV 2013 SP1. With debugger
C:\Program Files (x86)\National Instruments\Eclipse\toolchain\gcc-4.4-arm\i386\bin\arm-none-linux-gnueabi-gdb.exe
No experience with 2014 toolchain yet...
CLA, CTA, CLED
09-19-2014 08:29 AM
- Mark as New
- Bookmark
- Subscribe
- Mute
- Subscribe to RSS Feed
- Permalink
- Report to a Moderator
nanosleep() is a function that is used when waiting to execute something. This is normal that you would attach to the running process when it was in nanosleep() and, further, since this is an OS/system library-provided function, you would not normally have source for it. Simply set a breakpoint for your function and continue execution
09-22-2014 03:29 AM
- Mark as New
- Bookmark
- Subscribe
- Mute
- Subscribe to RSS Feed
- Permalink
- Report to a Moderator
sorry for using this thread, but I got the same issues with my brand new cRIO 9068 without any way of fixe up to now...
I tried all above... (also http://www.ni.com/tutorial/14690/en/), further I tried switching debug launcher (auto, manu, standard), I tried starting gdb server on target manually and got after starting debug (with empty 'command execution before...') in eclipse "gdb can't bind address already in use", I tried it with "gdbserver 192.168.0.60:2345 --attach 'pidof lvrt'" and got "Signal 'SIGSEGV' received. Description: Segmentation fault."... nothing works except debug on command line shell (without eclipse) - but this isn't what I want in the year 2014...
When I debug a simple executable file without labview relations the debugger in eclipse works fine.
Have you any suggestion what's going wrong?
Thank you for your support!
09-24-2014 03:31 AM
- Mark as New
- Bookmark
- Subscribe
- Mute
- Subscribe to RSS Feed
- Permalink
- Report to a Moderator
screems after a new tutorial for this one http://www.ni.com/tutorial/14690/en/
But for Labview 2014 and C&C++ Development Tools for NI Linux Real-Time, Eclipse 2014 Edition.
And hopefully fast? 
09-24-2014 09:08 AM
- Mark as New
- Bookmark
- Subscribe
- Mute
- Subscribe to RSS Feed
- Permalink
- Report to a Moderator
jens.reckwell wrote:
...
I tried it with "gdbserver 192.168.0.60:2345 --attach 'pidof lvrt'" and got "Signal 'SIGSEGV' received. Description: Segmentation fault."
...
Make sure that you command uses back-ticks (`, top-left of the standard QWERTY keyboard) instead of single quotes (', adjacent to carriage-return on a QWERTY keyboard). Alternately, you could use $(pidof lvrt).
The noted document has been updated for 2014, however likely only in the capacity of noting that there is an x64 debugging flow for the newer cRIO 903x targets.
09-25-2014 03:38 AM
- Mark as New
- Bookmark
- Subscribe
- Mute
- Subscribe to RSS Feed
- Permalink
- Report to a Moderator
I tried this also... and... I have no troubles with a stand alone app w/o labview + shared library on cRIO target and no troubles with the console debugger with labview on cRIO... I'm unable to explain the differents between the eclipse debug handling and the console debug handling.
09-29-2014 03:11 AM
- Mark as New
- Bookmark
- Subscribe
- Mute
- Subscribe to RSS Feed
- Permalink
- Report to a Moderator
I still get it not running. But in the meantime I don´t get any failure. If I want debug the application I get this screen:
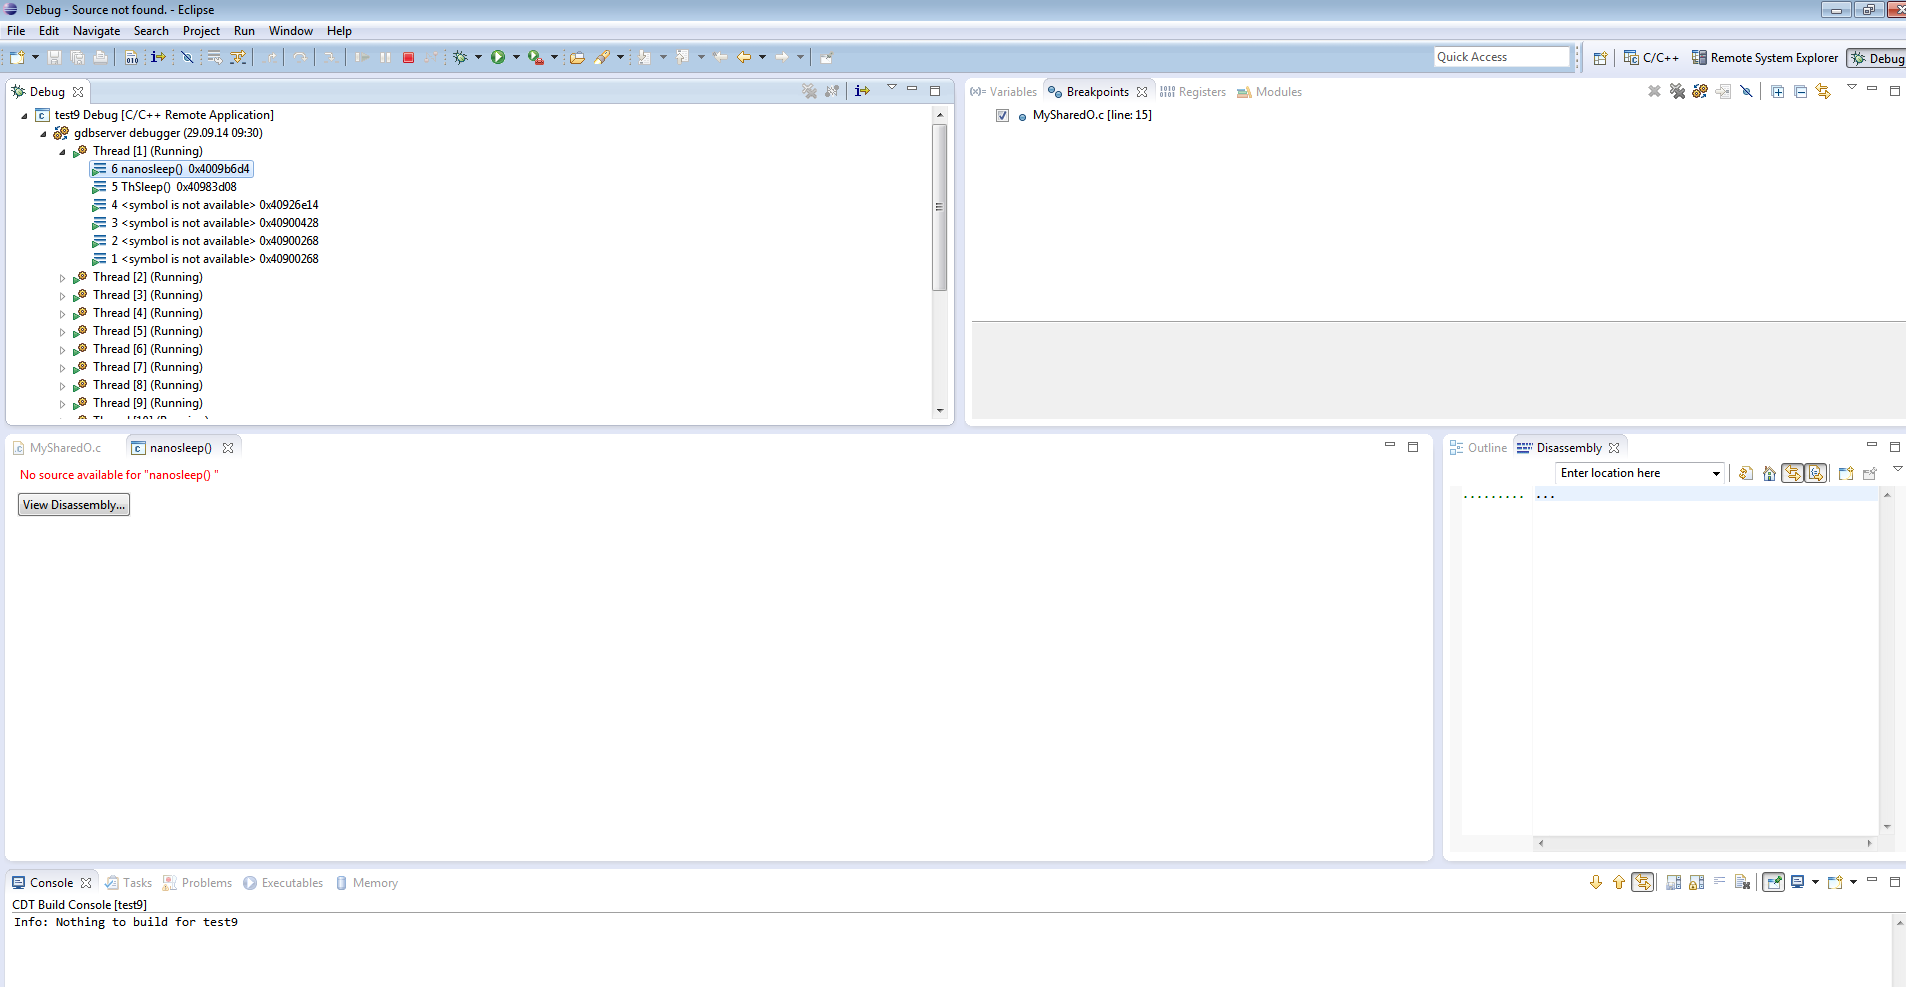
It seems that the debugger is running, because I see the stop button. Under Thread 1 I see 6 Tasks. Task 1-4 (symbol is not availiable), 5 ThSleep(), 6 nanosleep(). This screen occur about 5 seconds and change automatically into this screen:
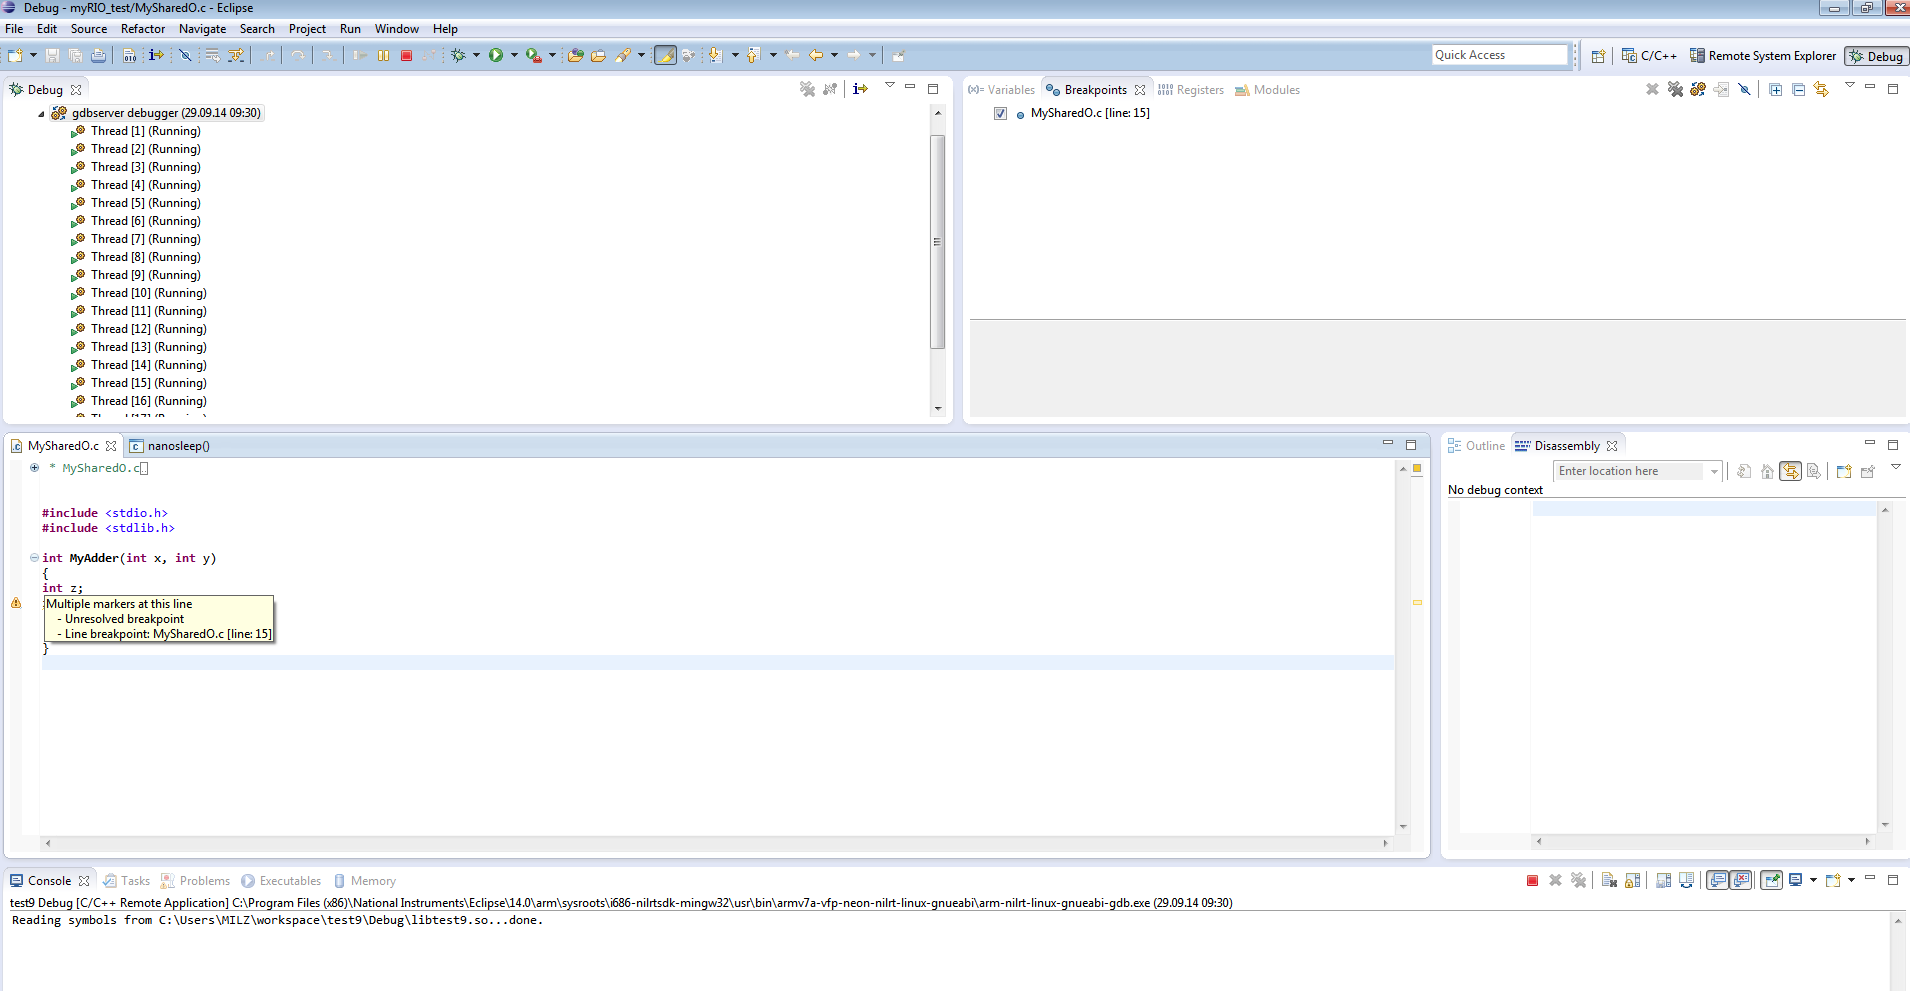
All Threads are running. But nothing happens. In my c-file I have set a breakpoint. At his point I see a problem: unresoved Breakpoint.
I think I do something wrong. So for me I have 2 questions:
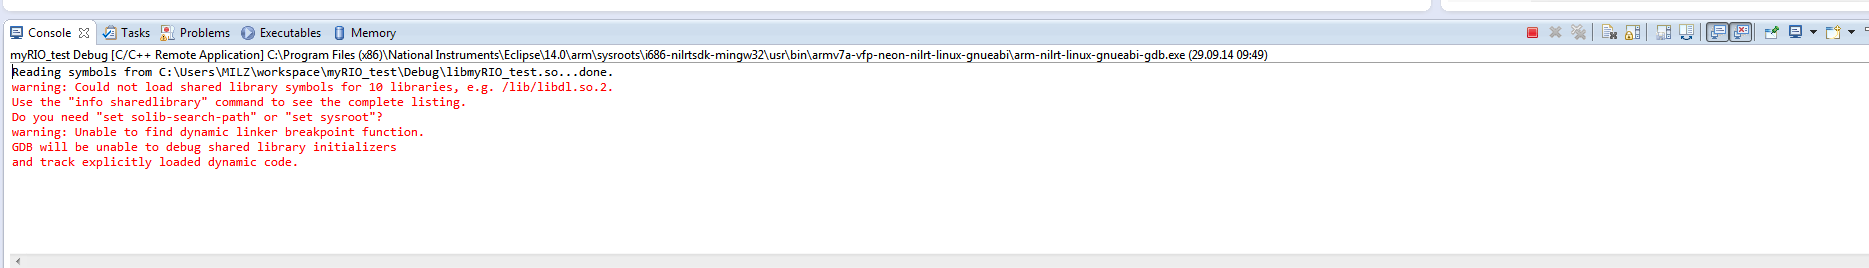
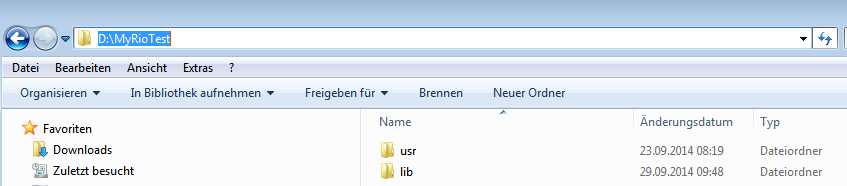
1. In the tutorial (http://www.ni.com/tutorial/14690/en/) under point3 (Debugging) stands that I must copy the /usr and /usr/lib directory (or the directory contains your .so files) over to the host computer.
The /usr/lib is included in the /usr, so I think I must copy the /lib library else I get this failure:
So my <RootFileSystemDir> looks in Windows explorer like:
and my associated .gdbinit file:
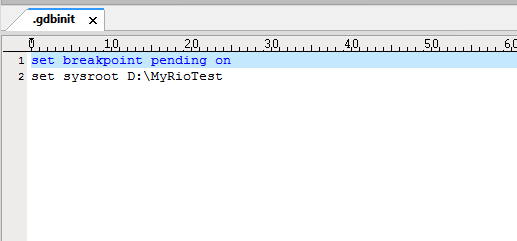
Is in this question something wrong?
question 2 is:
Because I never see this screen (how pointed in the NI turorial):
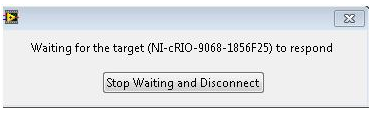
What must I do with the myrio device? Must I only call Eclipse with debugging or must I first make a startup application on the device or must I call Labview after Eclipse?
THX
Holger
