- Document History
- Subscribe to RSS Feed
- Mark as New
- Mark as Read
- Bookmark
- Subscribe
- Printer Friendly Page
- Report to a Moderator
- Subscribe to RSS Feed
- Mark as New
- Mark as Read
- Bookmark
- Subscribe
- Printer Friendly Page
- Report to a Moderator
Contact Information
University: D.J. Sanghvi College of Engineering (Affiliated to University of Mumbai)
Team Members: Shaival Sheth, Agraj Shah, Anuj Shah
(Electronics Engineering)
Faculty Advisors: Dr.RameshVulavala
Prof.Prasad Joshi
Prof. Mayur Parulekar
Prof.Ritesh Singh
Email Address: shaivalsheth@ieee.org
Project Information
Title: Modernisation of Pressure Control System using LabVIEW
Description:
This project describes the design and development of a feedback control system that maintains the pressure of a process at a desired set point, which can be varied in real-time, using NI LabVIEW.
Products:
Hardware: Pressure Tank System, NI USB DAQ-6009, LM-324, XTR-110KP, Pressure Transducer
Software: National Instruments LabVIEW 2009 (Control Design and Simulation Toolbox).
The Challenge:
The highlight of this project was the modernization of an obsolete pressure control system in the Chemical Engineering Department of our college,and its reinstation to working condition by means of advanced hardware and software tools such as USB data acquisition card (NI USB-6009) and NI LabVIEW respectively. This kit was non-operational and the students could not perform their laboratory work on the system. All they could do was study the parts of the system, without ever running the system. The reinstating of this system would not only allow students to perform their practical-sessions but it also meant the saving of approximately $3000, which would otherwise have to be invested in a new system, by the institution.
This project also allowed us to use LabVIEW for the very first time. We hope to encourage other interested junior students to implement their senior-design projects using LabVIEW.
LabVIEW:
We had absolutely no prior experience with LabVIEW so learning the software completely by ourselves was a big challenge. But in the end the scalability of its use was phenomenal and it made a huge impact on our project.
Uncertainty of system parameters:
Many of the specifications pertaining to the pressure system had been lost over the span of 10 years. Some experimental cycles had to be performed not only to determine whether the components in the present system were in working condition, but also to determine their characteristic behaviour . Further, the absence of an automatic safety vent valve, meant that the system was hazardous to operate at maximum operating capacity, and hence put further limitations.
The Solution: LabVIEW and NI USB-6009
Fig 1:The Process Block Diagram
Explanation of Fig.1:
- The set point can be varied in real-time by controls on the front panel of the LabVIEW VI.
- The Pressure Transmitter senses the pressure in pressure tank.
- It gives a corresponding output current which is converted to a voltage in the range of 1- 5 V by the I/V converter.This is given as an input to the DAQ card.
- The DAQ card accepts this voltage and communicates with LabVIEW.
- This voltage represents the process variable. The PID controller designed in LabVIEW compares this process variable with the set point selected by the user.
- The control signal is calculated by the PID controller and is given out by the DAQ card in terms of voltage (1-5V).
- This is converted to a 4-20mA current using a V-I converter through a voltage buffer.
- This current is given to the I-P Converter which gives out an equivalent corrective pressure output using a constant input of 20psi.
The output of I-P Converter which lies in the range 3-15 psi, actuates the diaphragm valve accordingly, and thus the pressure in tank varies.
- Pressure is constantly monitored by virtual gauges as well as actual analog gauges.
System Transfer Function
This was obtained by performing a series of experiments on the system, in open loop configuration.
To overcome the human errors that were encountered in these experiments, the TDMS feature of LabVIEW was used for Data Logging (Fig.5).
The approximate Second Order Transfer Function of the system is as follows:
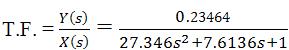
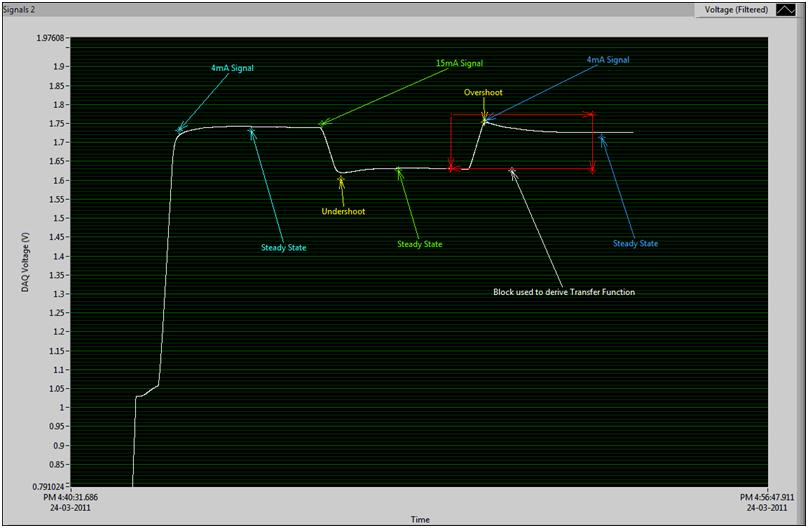
Fig 2: An example of recorded data during one of the experiments.
Results:
The Pressure Tank System was connected in closed loop configuration and all the other associated circuits and equipment shown in Fig 1.were included.By experimentation and repeated trials the following P-I-D parameters were observed to give suitable results when the system was connected in closed loop configuration.
- Proportional Gain: 150
- Integral Time: 0.08 minutes
- Derivative Time: 0.000 minutes
Please Note: Although the initial aim was to achieve P-I-D Control, it was observed after extensive trial runs that the Derivative Time was not required.
Some reasons for this decision is as follows:
1) The process involves air-flow. This process can be classified as a fast-reaction process. The moment there is a change in the set-point or there is a disturbance, corrective action begins almost immediately.
2) The process variable, when read by LabVIEW had some noise superimposed over it. This can be observed from the graphs below. This noisy process variable caused excessive derivative action, and led to severe oscillations of the control(actuation) signal. This was relayed to the actuator(Diaphragm valve). Excessive actuation could have easily caused damage to the old valve.
Due to these reasons, it was decided that it was best to use only P-I Control, instead of P-I-D.
As shown in the results below, P and I alone was infact giving suitable closed loop control.
This kit is now made available for use to study Control Systems Engineering at the under-graduate level. The reinstation of this system meant the saving of approximately $3000, as mentioned.
A set-point of 20 psi was given to the system. The system reacted accordingly and achieved a steady state of 20 psi.
Some critical parameters were recorded using TDMS feature and are shown below in Fig 3, Fig 4 and Fig 5.
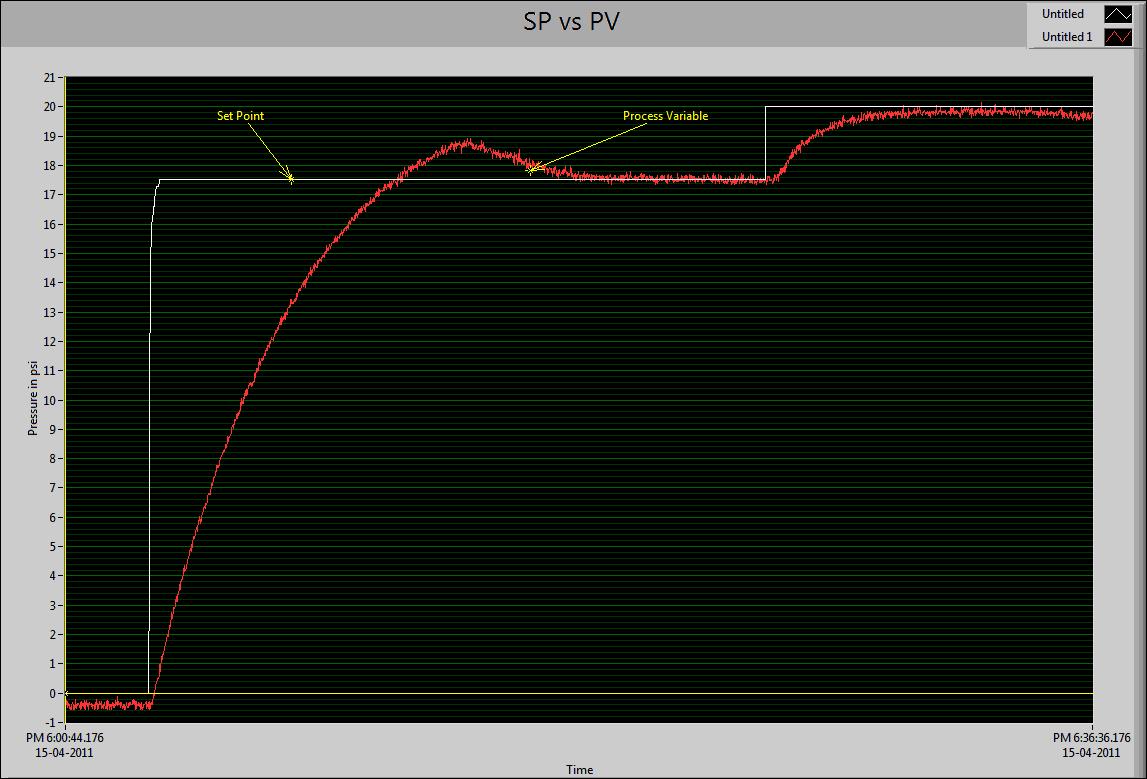
Fig 3:Comparison plots: Set Point and Process Variable
Fig 4:Comparison plots: Controller Output (Percent vs Voltage)
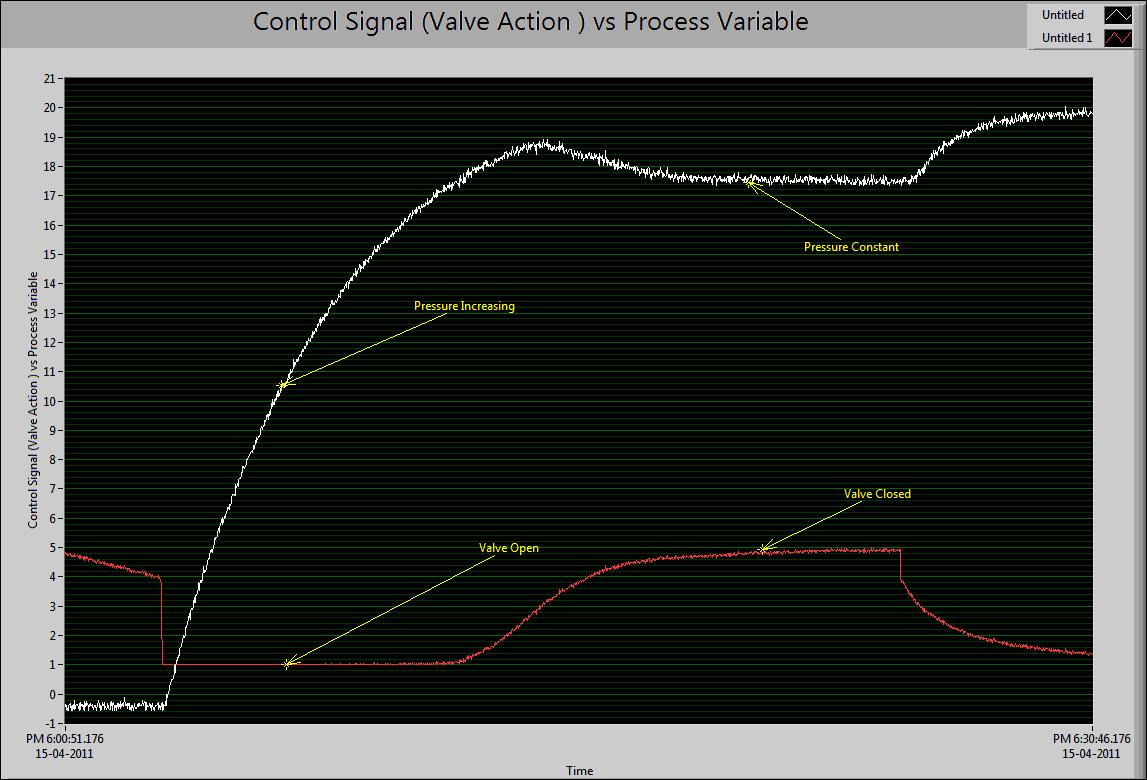
Fig 5:Comparison plots: Controller Signal (Valve Action)vs Tank Pressure
A disturbance was introduced in the system as follows:
The system was allowed to attain steady state for a set-point of 20 psi. The vent-valve provided for the pressure tank was suddenly blocked. This disturbed the steady state of the system. Responses of certain critical system parameters were logged and their plots are shown below.
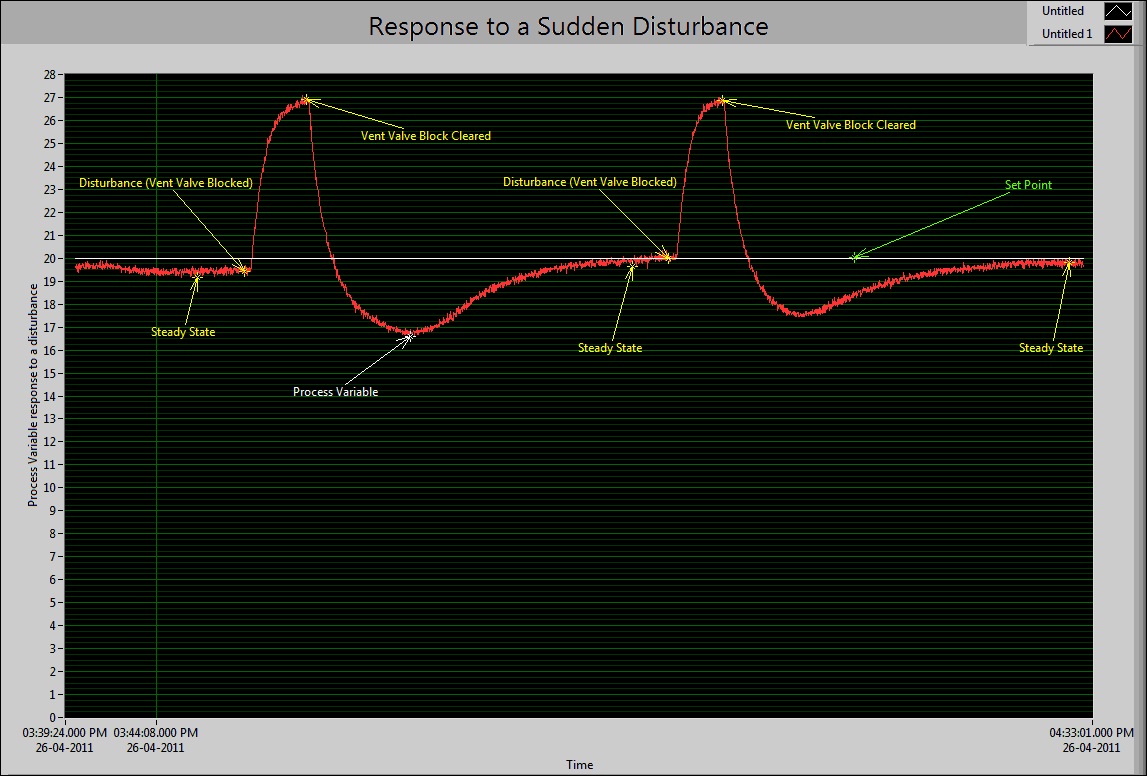
Fig 6:Comparison plots: Set Point vs Process Variable plot for a disturbance.
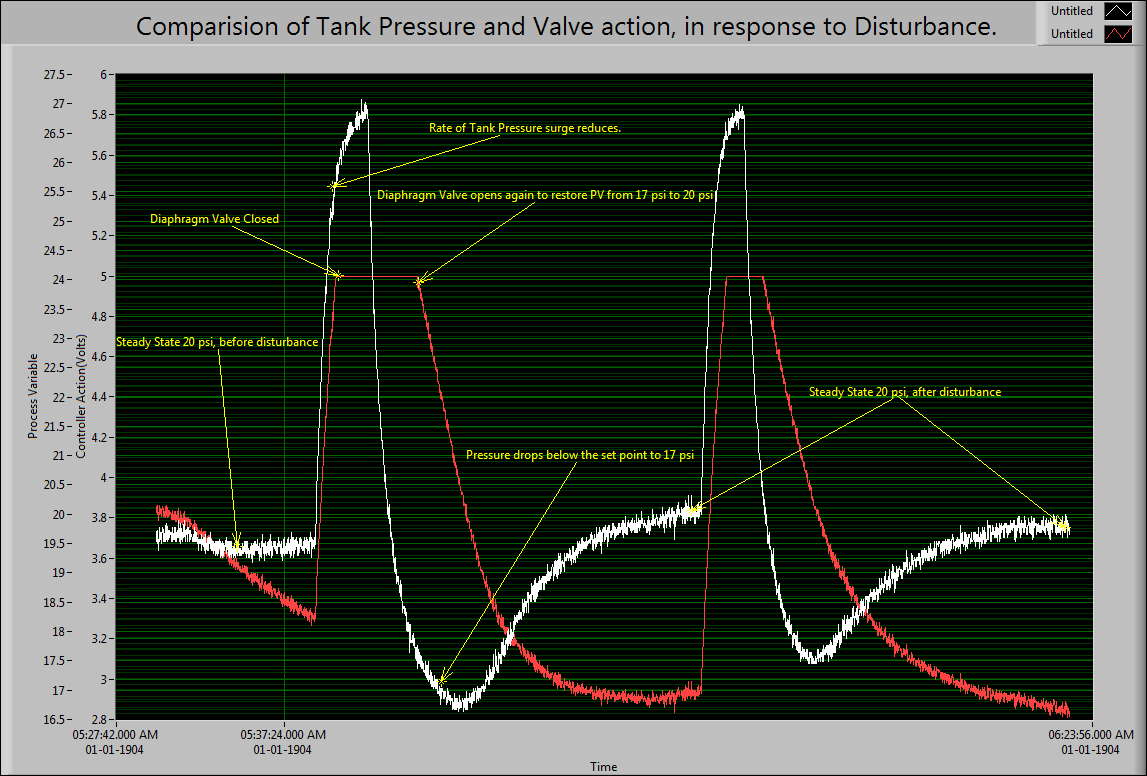
Fig 7:Comparison plots: Valve Action vs Tank Pressure for a disturbance.
Observations and Statistics for the above plots, from corresponding LVM files:
Time(s) | Action |
0 | Data Recording Starts. System at steady state at 19.5 psi. |
27.703125 | Vent valve blocked. Pressure starts rising. |
36.640625 | Vent valve block cleared. Pressure now at 26.909757 psi. |
77.500000 | System attains ~20 psi again and reaches steady state |
93.000000 | System at steady state at 19.6 psi |
94.500000 | Vent valve blocked. Pressure starts rising. |
101.796875 | Vent valve block cleared. Pressure now at 26.988225 psi. |
140.203125 | System attains ~20 psi again and reaches steady state. |
Time of Disturbance #1: 9 seconds | |
Time required by the system to reach steady state after clearing disturbance: 40 seconds | |
Time of Disturbance #2: 7 seconds | |
Time required by the system to reach steady state after clearing disturbance: 40 seconds | |
Benefits gained using LabVIEW and NI tools:
We selected National Instruments and LabVIEW for the following reasons:
- LabVIEW is a graphical programming environment that uses the visual block diagrammatic approach for connections rather than the syntax based programming approach as followed by some other tools.
- Hence there is a direct leap from logical thinking to implementation.
- One need not worry about the textual syntax, as in text based programming.
- It offers the simplicity of understanding to a new user how to connect various blocks of the system to obtain a run time simulation response and also allows one to change the parameters abruptly to obtain a change in the response of the system.
- LabVIEW has been indispensible. It provided us with excellent data logging, with features such as TDMS.
- Since it is a run time simulation environment any change in parameters immediately affects the response of the system. We manipulate this advantage of LabVIEW for tuning or designing our PID loop by varying the Kp, Ki and Kd gains to obtain a perfectly stable response from the controller.
- Further,LabVIEW allows us to seamlessly integrate software and hardware by using NI's DAQ devices. It does not require us to spend valuable time in writing codes for drivers to use the hardware.
- Lastly,by learning to use LabVIEW, we gained an invaluable skill-set, which will not only be useful to us when we pursue study at Graduate School, but also in the Control and Automation industry where LabVIEW finds many applications.
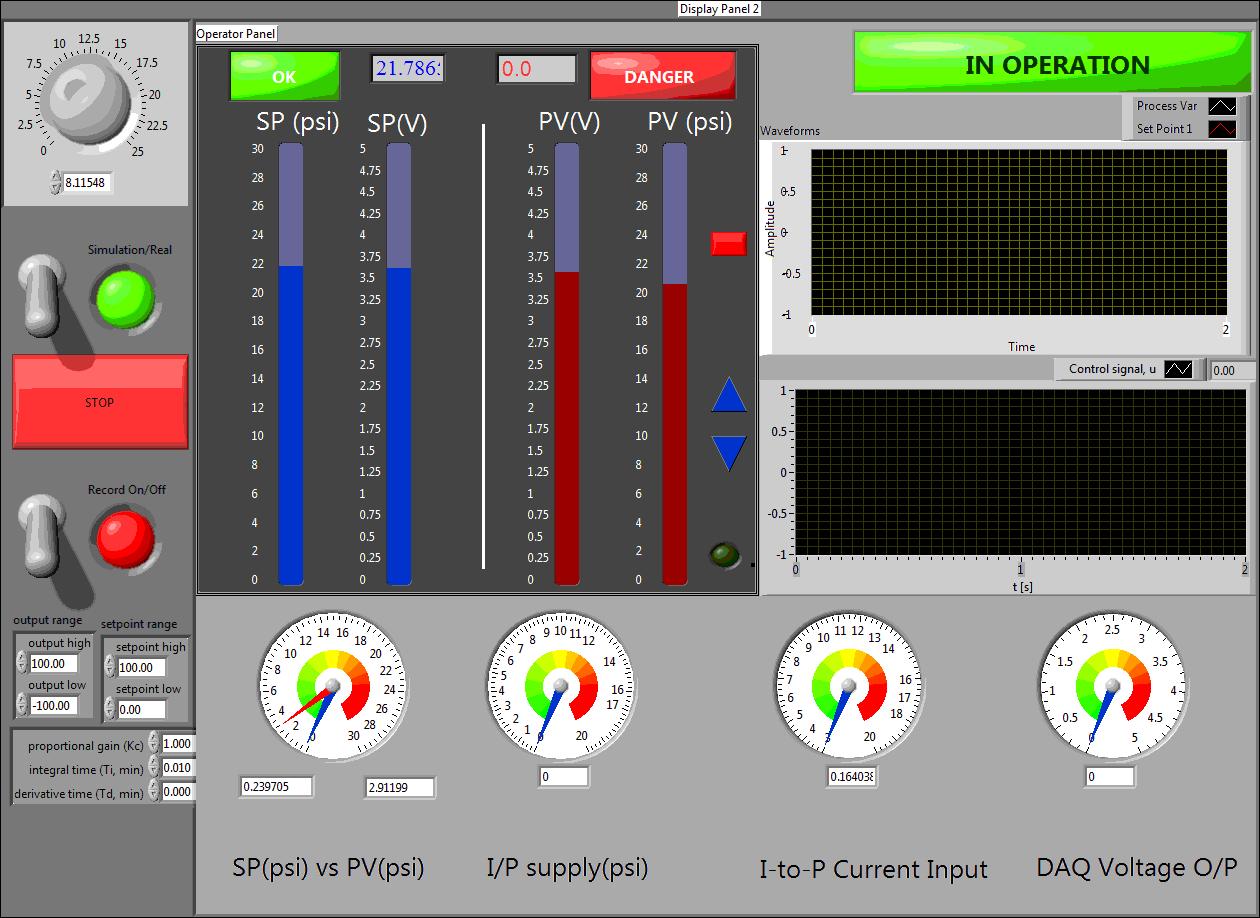 Fig 8.Final VI Snapshot
Key features:
- Highly interactive Front panel
- All possible system parameters can be viewed on the front panel together
- Three of the four gauges directly correspond to the actual analog gauges of the system, while the fourth one is used to keep a track of the DAQ output voltage.
- One Switch(Simulation/Real) has been included for effortless transition between the simulated Transfer Function and the real process. If the system is currently running in Simulation and if the user wants to shift to the actual system, he has to just use the”Simulation/Real” Switch.
- Another switch(Record On/Off) has been implemented for use only when the system is running in the “Real” mode,i.e. when the actual system is connected. This switch allows the user to Record the Data being displayed on the front panel as a TDMS as well as LVM file. This allows the user to record data when he wishes. This has been done to allow post operation-analysis of the logged data, to investigate any abnormalities which may have occurred during system operation.
Some images of our project:
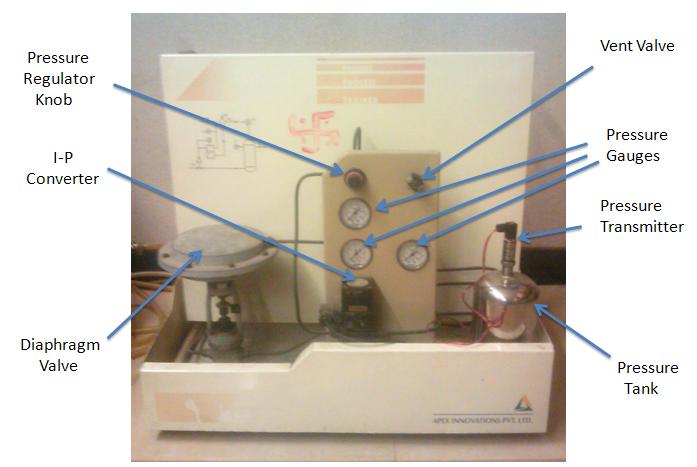
Fig 9:Pressure Tank System
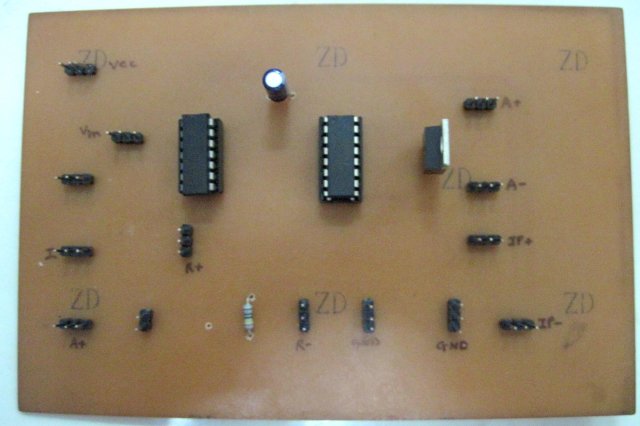
Fig 10:Self etched PCB including the Voltage Buffer and V/I Converter (XTR 110)
Although an inbuilt OP-AMP(within XTR 110) provided protection to the output port of the DAQ card, against loading, we used a simple LM324 analog voltage buffer as an additional precaution as shown in the above figure(Fig 8).
Video describing our System, LabVIEW VI and Closed Loop Control
- Mark as Read
- Mark as New
- Bookmark
- Permalink
- Report to a Moderator
Hey razor149,
Thank you so much for updating your project submission. Can I delete your original submission so that you can collect votes on one document rather than having to share two linkes? Please let me know and I can make the correction. And make sure you share your NEW project URL (https://decibel.ni.com/content/docs/DOC-15850) with your peers so you can collect votes for your project and win. Collecting the most "likes" gives you the opportunity to win cash prizes for your project submission.
Good Luck, Kristine in Austin, TX.
- Mark as Read
- Mark as New
- Bookmark
- Permalink
- Report to a Moderator
Hi Kristine,
Thanks for the wishes .
Yes please delete the other one. I tried to look for it but couldn't find it.
Thank you.
- Mark as Read
- Mark as New
- Bookmark
- Permalink
- Report to a Moderator
Your's Project was really Good. Hope your College people had helped you so much with your project
- Mark as Read
- Mark as New
- Bookmark
- Permalink
- Report to a Moderator
Thanks Salai... Please "Like" it if you do not mind ! 

