- Document History
- Subscribe to RSS Feed
- Mark as New
- Mark as Read
- Bookmark
- Subscribe
- Printer Friendly Page
- Report to a Moderator
- Subscribe to RSS Feed
- Mark as New
- Mark as Read
- Bookmark
- Subscribe
- Printer Friendly Page
- Report to a Moderator
Contact Information
University: Friedrich Alexander Universität Erlangen-Nürnberg
Team Members (with year of graduation):
Gjergj Lala
Email Address: gjergjlala@gmx.de
Submission Language
English
Project Information
Title: Characterisation of Organic Photovoltaics with LBIC (Light Beam Induced Current) and PL (Photoluminescence) Mapping
Description:
The project is the combination of Light Beam Induced current and Photoluminiscence to characterise the solar cell throughout the surface. The measurements are taken by scanning the surface with the laser and for every position measuring current and photoluminiscence.
Products
Software used: Labview 2011- Labview 2012
"XPS-C8"
2x "Hight Performance Linear Stage, 150 mm Travel, Steper Motor"
"Laser 445nm Wavelength"
"Optical Lenses, Filters etc"
"Monochromator IHR 320"
"IGA Symphony II detector"
+ The required drivers for the devices
The Challenge
The idea beyond the characterisation of organic photovoltaics with light induced beam current and photoluminescence was to have a mashine that can do both characterisations. The characterisation of the solar cells would be by going to a certain point on the solar cell with a laser, measuring current and photoluminescence and then go to the next point and do the same. After finishing the all data points would create an intensity graph which it would show the current in to different points plus the photoluminescence on that point. The combination of photolumiescence and induced current would make the possiible to compare and coorelate both of them. By having that coorelation between photoluminescence and produced current will bring a big boost to the research or ogranic photovoltaics as then there is no need to make a complete cell in order to characterize. Just by taking the photoluminescene of a single layer could tell you how good the cell would be. Then instead of taking a day to make solar cell samples and characterize them, it would take just few hours.The coorelation between current and photoluminescence would bring also new knowledge about this new research field. And the third component which it is mapping will show different defects, efficiency variation on the cell which will lead to deeper knowledge.
The project itself will not bring much on changing the world but the progress that will bring in the research of solar cells could be great. That way indirectly it will help to fullfill the growing energy needs of humanity.
On that project my task was to create a program which it will handle all the hardware and make possible this kind of measurement. Since there is no mashine jet that can do both, the concept was all mine how to make the program, how it will look like and what excaclly it will do.
The Solution
The project does provide characteristics of the solar cell like efficiency, defects etc.
The concept is simple:
1. Go to first point
2. Get Current
3. Acquire Spectrum
4. Go to the next point
etc.
As simple as it seems the hole project to work required a lot of work as combining three different which they should work together increased the complexity.
Using Labview for bringing the hardware to work helped a alot since when a programm becomes complex in labview it is easier to handle than in a text based programming. Labview also supports a lot of insturments in which all three basic devices required for the project where supported. The controler which controls the axes comunicates over TCP protocol, the monochromator and ccd detector over USB.
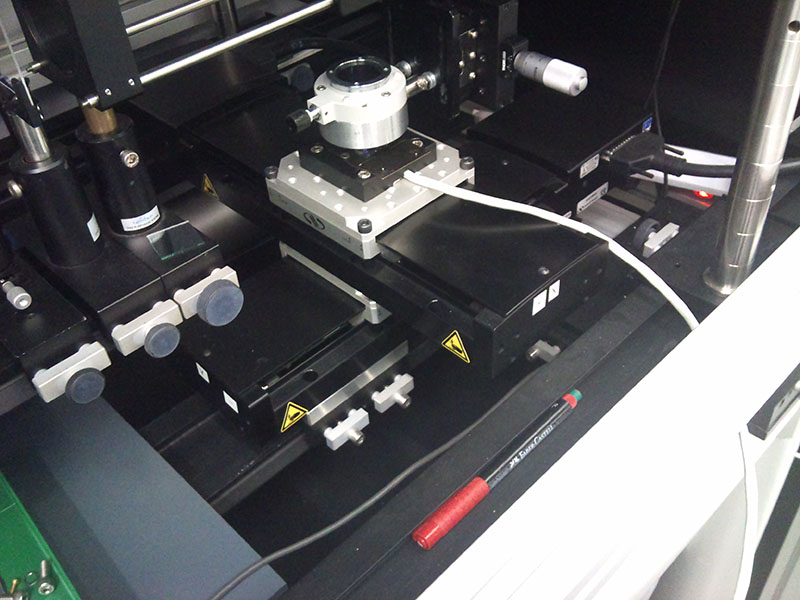
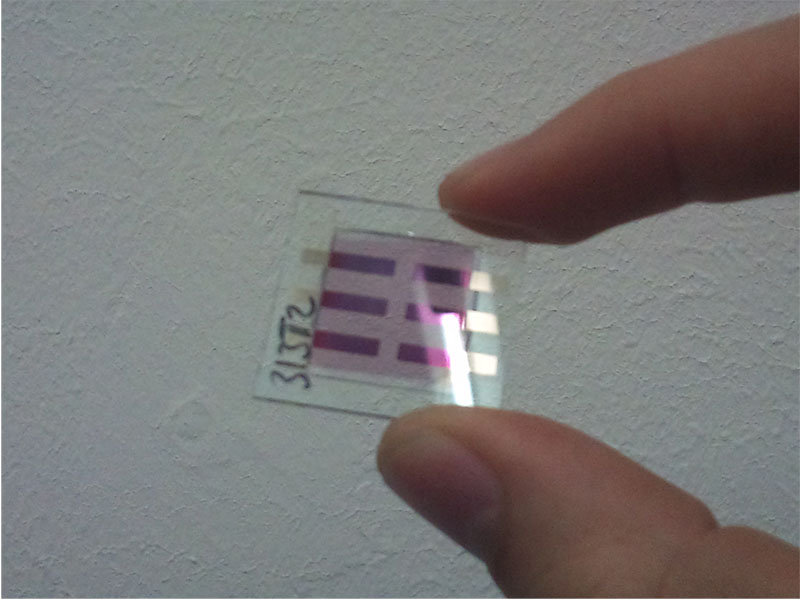
Image 1. The sample holder on the axes. (Inside there is a solar cell sample) Image 2. Organic Solar Cell
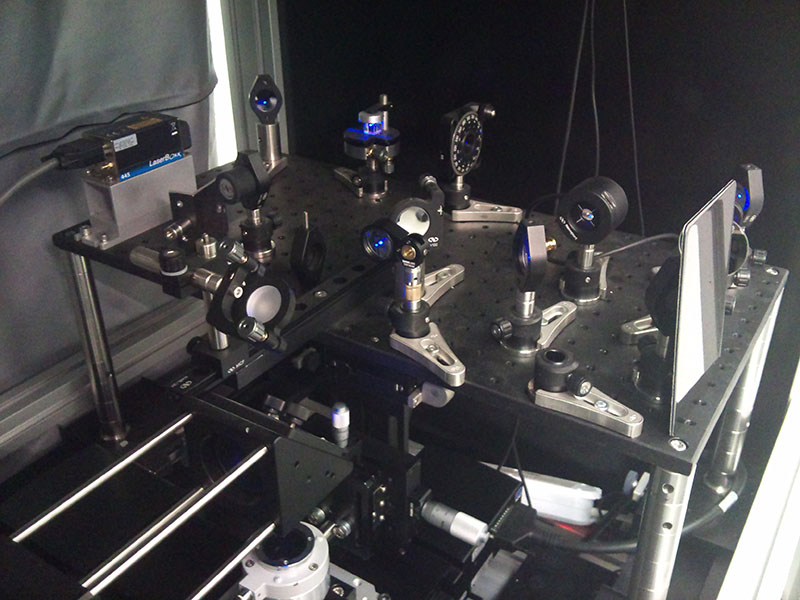
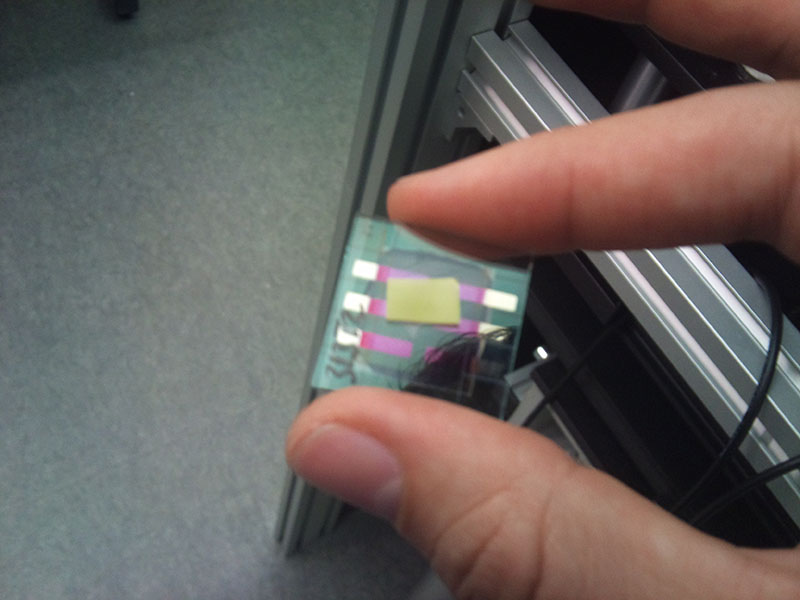
Image 3. Laster and the filters Image 4. The sample measured on the Video (the small yellow paper it is a vigh photoluminescence material
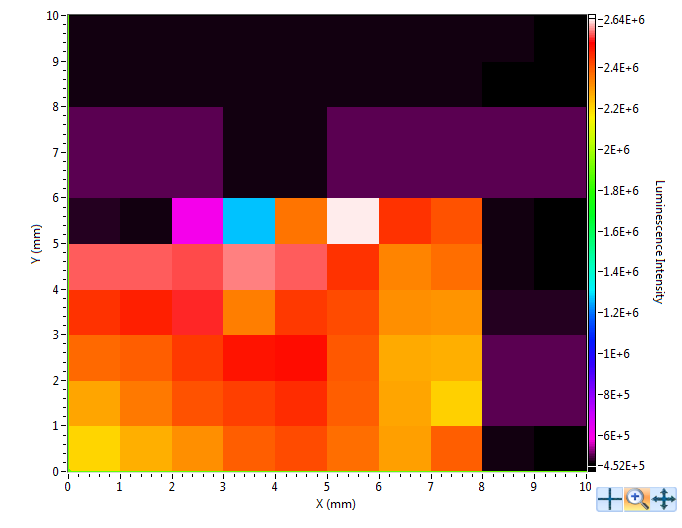
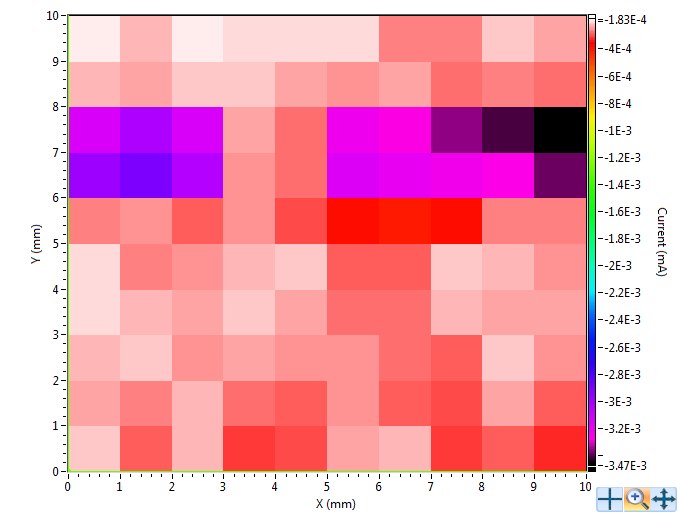
Image 5. PL mapping of a part of the sample (the red-orange part is the paper as shown in image 4) Image 6. Same area as image 5 but here we have LBIC mapping (current measurement)
Video Demostration of the Software working
I've Attachted a file that I've saved during the video. You can run the program, ignore the errors (there are errors because it does not find the hardware) and with the program you can open the saved data file. Try also to open it with a text file and Origin (the saved file format is tested on Origin 8.6).
The program it is still on Beta phase since it's graphical design it is not completed, and still needs to be tested in some cases in order to ensure the correct function.
I've developed it the programm all alone and the time estimated to reach that phase is about a Year.
Except the sample holder and the switchers for the cell samples (one cell sample has six solar cells on it) the hardware has ben asembled by
Dr. Andres Osvet .
The professor might not have time to use Labview in any way but he still deservers special thanks to Prof. Dr. Christoph J. Brabec and also more important to my suvervisors during the project:
Dr.-Ing. Gebhard Matt (Lbic part) and Dr. Andres Osvet (PL part) and a very good cooperation for the concept of PL to the PHD student M.Sc. Derya Baran .
