From 11:00 PM CDT Friday, May 10 – 02:30 PM CDT Saturday, May 11 (04:00 AM UTC – 07:30 PM UTC), ni.com will undergo system upgrades that may result in temporary service interruption.
We appreciate your patience as we improve our online experience.
From 11:00 PM CDT Friday, May 10 – 02:30 PM CDT Saturday, May 11 (04:00 AM UTC – 07:30 PM UTC), ni.com will undergo system upgrades that may result in temporary service interruption.
We appreciate your patience as we improve our online experience.
06-27-2010 09:35 AM
To give some perspective of the performance, our chart draws EEG signal monitoring with 160 channels, 40 kHz / channel. X-axis length is 10 seconds. With a quite new GPU, of course. That results in 6.4 million new data points/sec. And without down-sampling the signal.
Most chart controls for .NET can do < 1000 points/sec.
06-27-2010 11:02 AM
It seems to me like the Lightning Chart Pro package would be great for people trying to develop high performance instruments and need high-channel count / high performance graphing capabilities. If I was trying to develop a scope or data logger, the built in LabVIEW graphs and Microsoft chart tools just aren't up to the task. I don’t think ~$2k is a bad deal compared to the development time it would take an individual to do something better on their own. High price instruments or high volume products can more easily justify higher cost development tools like this. That being said those types of applications are only a portion of who uses LabVIEW, so I think if Acrtion only focuses on these types of users for a LabVIEW package they will probably find that there aren't a ton of customers.
This is where the Lightning Chart Basic package seems like it fills a gap, offering reduced performance at a much cheaper cost. This makes it more attractive to customers using it for data visualization in non-real-time environments, or people who want nice looking plots for relatively low performance data acquisition applications.
Some other options could also be a royalty based model (cheaper initial cost with a per-instance license fee), a 3rd package aimed only at static/very slow updates for report generation, or selling different graph types individually. How you guys choose to segment your product marketing is ultimately up to you, but if you do choose to make LabVIEW versions I think it would be a good idea to at least offer the Pro / Basic model you currently have. You may find the basic model has better success under LabVIEW than it has under .NET.
As a side comment I think the first customer for the PRO suite should be NI itself. Some of their applications like the instrument soft front panels could certainly use the aesthetic help.
06-29-2010 05:47 PM
Ok, it seems it is necessary to make two versions of LightningChart toolkit for LabVIEW. Let's call them Basic and Pro. Basic could be around $ 500 and Pro $1000...1500.
Now, keep those ideas coming! What kind of data visualization tool palette items would you like to have in Basic toolkit and Pro toolkit?
Here's the plan of tool palette items in LightningChart Pro toolkit:
- High-speed data acquisition monitor, many different scroll/sweep modes. Unlimited channel count. Performance ~10MSamples/sec, with at least 30 fps refresh rate
- Oscilloscope with level triggering. Performance ~10MSamples/sec, with at least 30 fps refresh rate
- 3D FFT Spectrum monitor
- 3D surface, evenly-spaced grid, freeform mesh, with optional wireframe, contouring and amplitude coloring
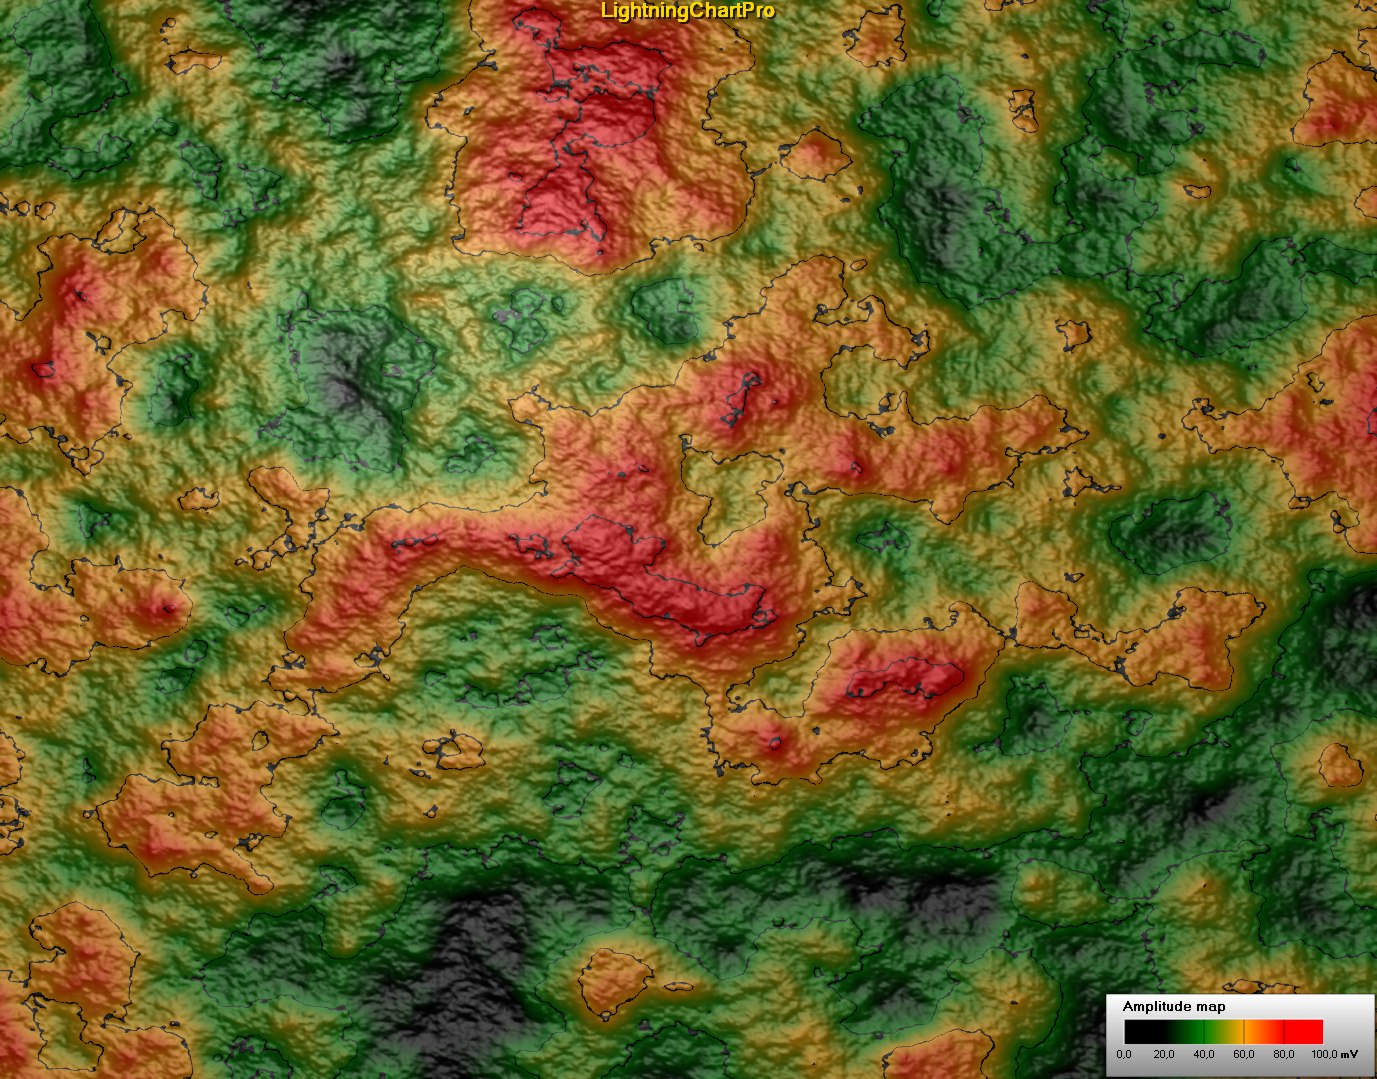
- Intensity/Heat map
- Lissajous figure monitor?
- Polar chart
- 3D point-line chart
- 3D bar chart
And the plan of tool palette items in LightningChart Basic toolkit:
- Low performance data acquisition monitor, with max. 2 channels. Performance about same than LabVIEW's chart/graph controls.
- Low performance oscilloscope with level triggering, ~100 kSamples/s
- 3D surface, evenly-spaced grid, limited grid size, with optional wireframe, contouring and amplitude coloring
- Polar chart
- 3D bar chart
More ideas, please! Ask your buddies too! You can wish any kind of data visualization control. It does not matter if LightningChart has the feature or not. Ideas are always welcome, even if they were totally insane.
06-30-2010 07:35 AM
Bar charts are a real weakness of the built in controls. I would offer a complete set (2D & 3D) of bar charts in your basic package. I think it's pretty common to run up against the limits of the built in bar charts (as soon as you want to use a string category label, for one) and this could be the primary reason developers find this product.
07-02-2010 06:17 PM
Here's another picture of intensity/amplitude map of LightningChart 2.0 a 5.
07-05-2010 10:42 AM
The charts you have look great.
My primary interest is 3d volume rendering of multiple Xray and terahertz computed tomography slices such that you can provide very high quality renderings with slice views.
For example:
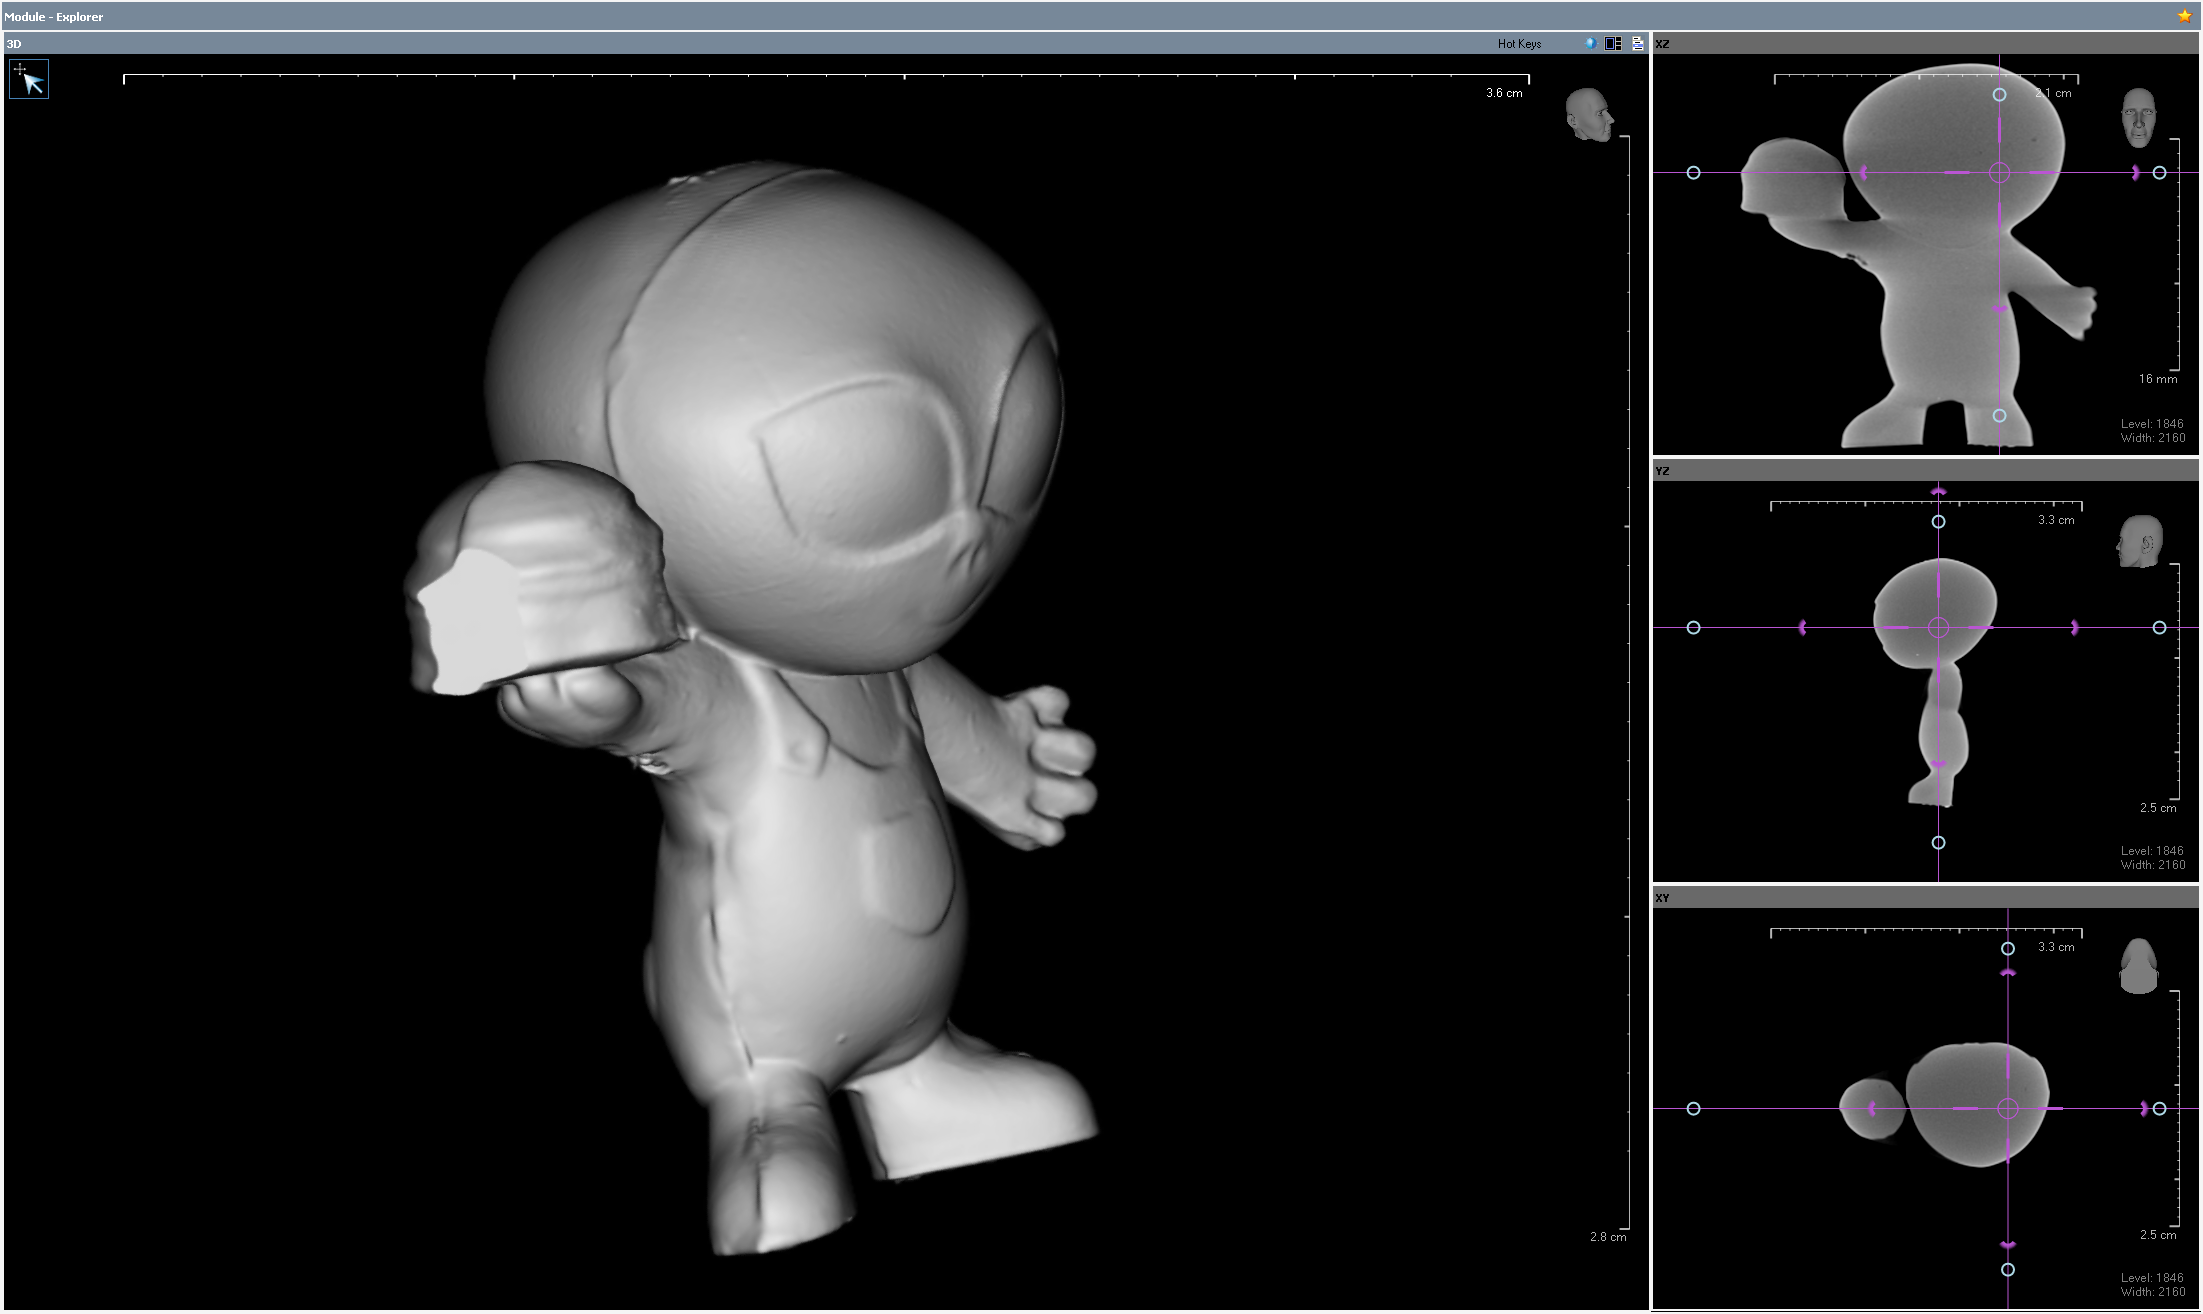
I have written my own LabVIEW code for slice views of CT data, and it works well (similar to what you see above). I tried using multi-surface rendering using the 3d surface graph based on some of the work done by Ben, Knight of NI, but it can only handle < 50 slices or so with any rapidity. It is also not a true way to do volume rendering.
Additionally, the 3d surface graph does not work with LabVIEW 64-bit which is the direction I need to go as I am working with gigabyte-sized data sets.
I am working with several 3rd party products right now to deal with the CT volume renderings.
Sincerely,
Don
07-14-2010 08:28 PM
Hi Don,
Biomedical Startup Kit (http://decibel.ni.com/content/groups/biomedical-user-group) will release a new version including a 3D Image Reconstructor. Looks like this: (using Isosurface algorithm)


Is this helpful to you?
ZJ Gu
07-15-2010 07:14 AM
ps. I should have said that I am also interested in 2-d charts and graphs but I am able to make do for the purposes of my work with the built-in LabVIEW charts at the current time (except I have had to customize the intensity graph for ultrasonic phased array S-scan display).
I also should have said the older ActiveX-based surface graph is not working in the 64-bit version - but LabVIEW has replacement surface graph technologies which I will have to use....Don
07-15-2010 07:17 AM
In terms of using the 3d picture control for volume rendering, I would have to see more. I would have to know if it can handle very large data sets (64-bit version), and allow reasonably rapid manipulation. I can send you the data set I used for my initial posting if you want to try it, or have me beta test the kit.
Sincerely,
Don
08-06-2010 06:09 PM
Hi Don,
Volume rendering is a very interesting new aspect for data visualization package. We are dealing a lot in medical measurements already by LightningChart user applications and it would almost natural to extend our libraries in this direction. I've discussed with our partner developing high-speed volume rendering technologies and unfortunately they don't see many customers for it in LabVIEW users. High-speed volume rendering controls and software are expensive and it probably would be impossible to include such in LightningChart Basic or Pro package. Maybe the most volume rendering technology users are in Visual Studio C++ or .NET world. Developing volume rendering system would be very interesting to us too, let's see what happens in the future.
Thanks Don, and thanks ZJ Gu for telling you have a volume rendering system in the Biomed kit.
