From 11:00 PM CST Friday, Apr 11th - 1:30 PM CST Saturday, Apr 12th, ni.com will undergo system upgrades that may result in temporary service interruption.
We appreciate your patience as we improve our online experience.
From 11:00 PM CST Friday, Apr 11th - 1:30 PM CST Saturday, Apr 12th, ni.com will undergo system upgrades that may result in temporary service interruption.
We appreciate your patience as we improve our online experience.
Contact Information
University: Kingston University London
Team Member(s): Amr Kamal Mostafa Mohamed
Faculty Advisors: Prof.A. Ordys, Dr. Olga Duran, Mrs Gordana Collier
Email Address: K0850529@kingston.ac.uk
Title: Load Frequency Control in Power System Analysis.
Description:
This study describes the load frequency control (LFC) of isolated and interconnected power systems using I, PID and fuzzy logiccontrollers. Simulations are carried out to study the performance of the powersystems focusing on the assessment of the most efficient controller which can generate the best dynamic response following a step load change.
Products:
LabVIEW 2010 Student edition
The Challenge:
The load frequency control is used to maintain the frequency of the electrical network and keep it at rated value (in UK =50Hz & US = 60 Hz) during any disturbance happened from generation side of load side. In addition to that,there is other disturbance might affect the frequency of the network which willcome from other area connected to the same network. For instant, if we have two areas connected together and because of internal fault in area one the turbine has been tripped and the generation from area one has been lost. That will decrease the network frequency (assuming the rated frequency = 60 Hz) the network frequency will be below 60Hz. Thus, if the generation unit in area two didn’t recover loss of generation in area one by increasing the generation power in order to keep the frequency on acceptable range, the frequency protection in area two will activate and trip the unit, that will case loss ofgeneration in both units. If these two areas are connected to other areas thesame scenario will happen.
Frequency stability can be defined as, the ability of power system to maintain steady frequency within an acceptable range (± 0.5%). It depends on the ability to keep the balance between a generated power and load demand, with minimum loss of load. There are two systems of interest namely isolated system and interconnected system [1].
In this project, a model of one power plant (isolated system) having four-source power generation units connected to load is considered (figure 1). The total generation is from non-reheat-steam turbine, reheat-steam turbine, hydro turbine and gas turbine. The main objective is to keep supplying the load at rated frequency therefore, a controller is required to deal with any sudden increase or decrease in load demand which will affect the frequency.
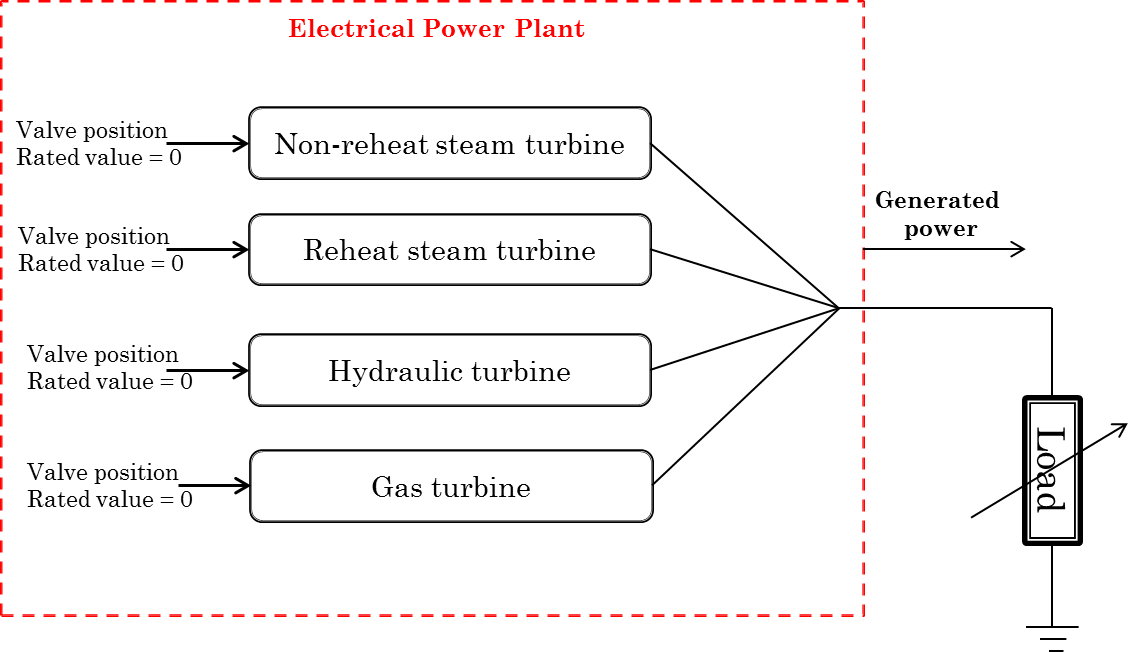
Figure1: Electrical power plant withfour generation units supplying isolated load
Moreover, electrical network can be defined as an interconnection of electrical elements, such as voltage and current sources,switches and transformers. In real power systems, power plants across the country are called “control zones” or “areas”. These areas are mostly connectedin order to create an electrical network across country or across city. That will help to increase the power quality and minimize losing of generation power due to maintenance or sudden shut down. The operation principle of the interconnected area is as following:
Each area is responsible to feed its own load and feedloads in other areas during a schedule power sharing. That will keep thefrequency at nominal value because the generation power will be equal to the demand power. However, if a sudden load increase happened in one area the network frequency will drop immediately therefore, other area will respond byincrease its generation power in order to return the frequency back to its nominal value.
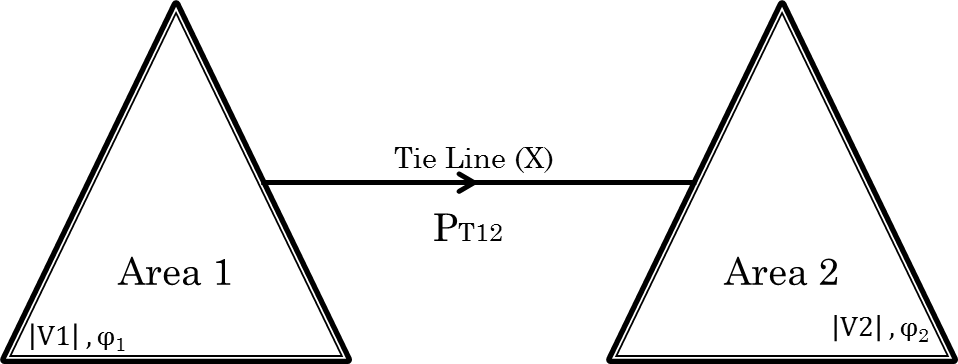
Figure2: Simplified representation of a power system with two areas.
In this poject, an interconnected model of two generation units are considered. Area one has two reheat-steam turbines and area two hastwo hydro-turbine units. Both areas are connected together through a tie line model. The main objective of using labview is to design a control strategy to keep the frequency constant during any disturabance at any area plus to keepfair sharing in power between these two areas.
The Solution:
This project is dealing with the frequency problem intwo main systems, isolated system and interconnected system. Labview is used for both systems to do the following:
1- Isolated power system problem:
From literatures [2], [3], [4], [5], a linearized models of non-reheat, reheat, hydro and gasturbines equipped with speed governors are used. The complete block diagram ofthe considered model in this study is shown in figure (3). The considered power plant has output power equal to 2000 MW with frequency 60 Hz.
.png)
Figure3: Transfer function block diagram of controlled Non-reheat, reheat,hydro and gas power generation system
During normal operation condition, the generated poweris equal to the load power which means that the frequency deviation is equal tozero. However, during any sudden increase or decrease in load demand the frequency deviation is decrease or increase respectively. The disturbance can be simulated by changing ΔPload as shown in table 1.
Table 1: step changes in load demand
| Sudden loss of load | Sudden increase of load | ||
|---|---|---|---|
| Δ P load 1 | -200 MW | Δ P load 4 | 200 MW |
| Δ P load 2 | -400 MW | Δ P load 5 | 400 MW |
| Δ P load 3 | -600 MW | Δ P load 6 | 600 MW |
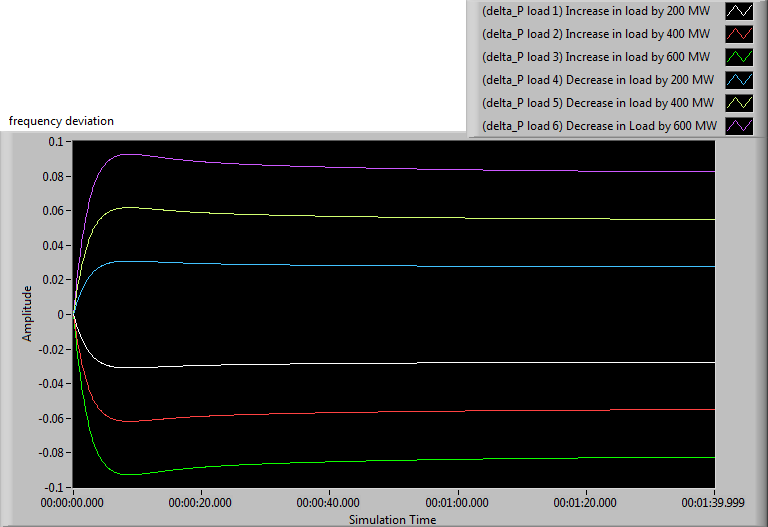
Figure 4: Simulation result of uncontrolled isolated model using labView software
As shown in figure 4, the frequency is dropped duringany change in load therefore, additional action is needed. The most common wayto do that is by applying an integral controller which called (conventional frequency controller). However, the main target of this project is to design acontroller with high performance to control the frequency and return thedeviation to zero at minimum time. For this application I controller is conventionally used, as described in [4]. Thus, Labview is used to compare between Conventional I controller and PID controller. The controller has placed as shown in figure 3 for each turbine.
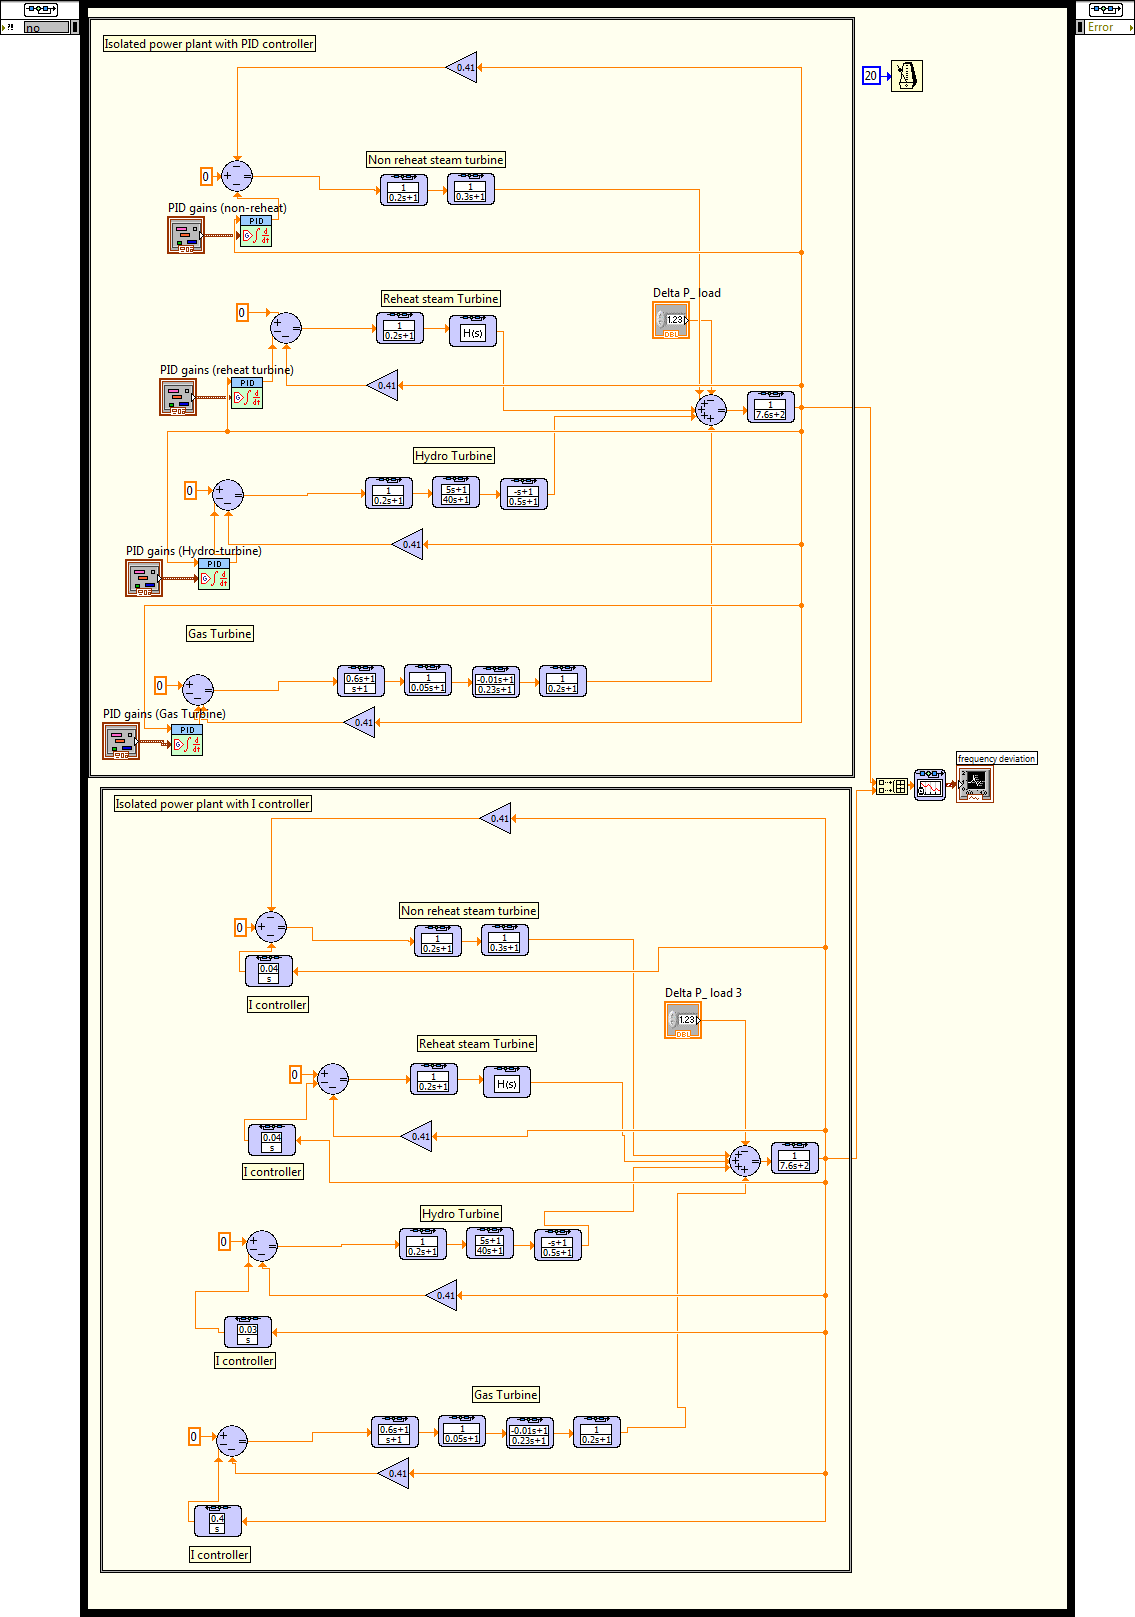
Figure 5: The transfer function block diagram of I and PID controller of isolated model by Labview software
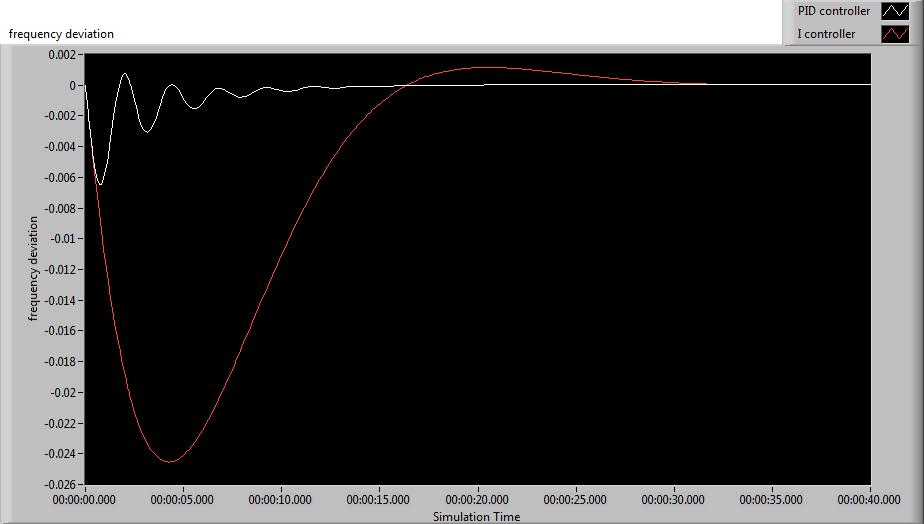
Figure6: model response with I and PID controller during sudden increase inload by 200MW (Labview software)
The simulation result obtained show that PID controller is better than the conventional I controller. In reality, Labviewsoftware can be used as a frequency controller by connect a certain inputs to it and with proper controller design the generated output can solve the frequency problem in power plants with cheap cost.
1- Interconnected power system problem:
Considering a two areas model each area has two generation units (figure 7). Area one has two reheat-steam units and area two has two hydro-turbine units. Both areas are connected together through a tie line model.
The model is a simple example of electrical network. The main objective here is to apply a controlstrategy which can keep the frequency constant all the time even during any sudden increase or decrease in load demand and to minimize the unscheduled power flow between both areas.
By simulating the model in LabView software withoutany controller we can find that (figure 8,9), during a sudden increase in areaone by 0.1 Per Unit value (P.U), the frequency dropped in area one. Area two has increased the generation power to keep the frequency is same at both areas (network frequency). Δp12 is equal to -0,1 Per Unit value (P.U).That means, the unscheduled power is flow from area two to area one.
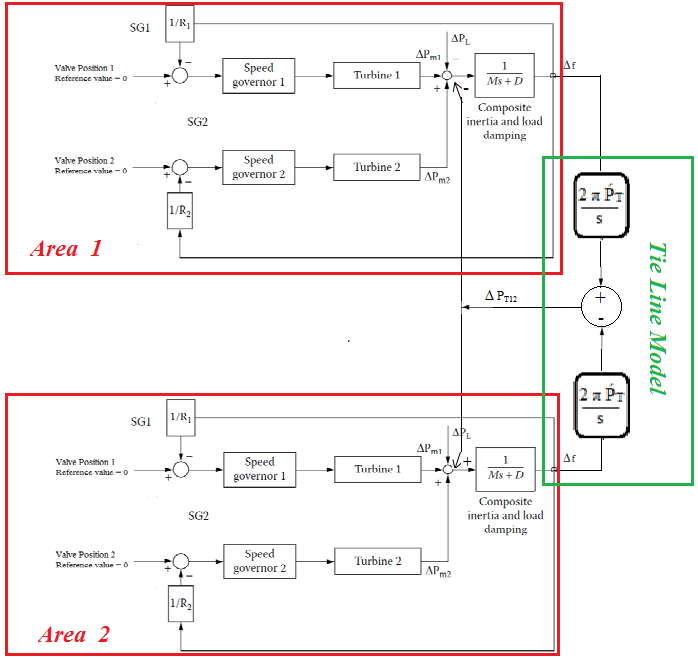
Figure 7: Block diagram of two area interconnected mode
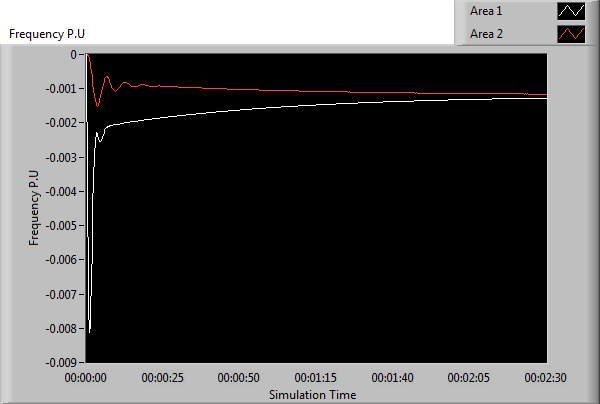
Figure8: the frequency deviation of an interconnected system during asudden increase in load at area 1 by 0.1 P.U (LabView software)
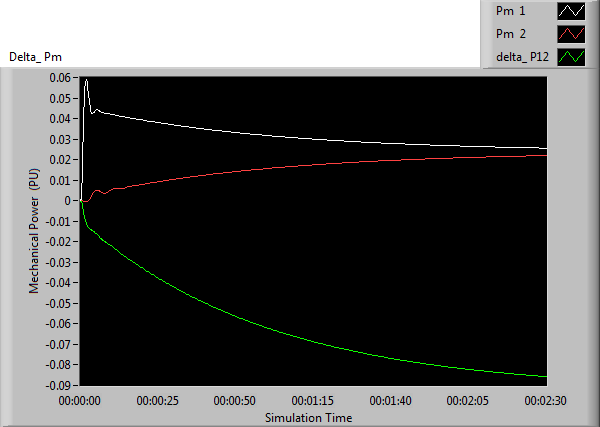
Figure9: The mechanical power response to interconnected model during asudden increase in load at area 1 by 0.1 P.U (LabView software)
The conventional control strategy for interconnectedsystems has been developed firstly by N. Chon [6]. The author has defined thearea control error (ACE) as follows:
ACE = (Ptie – Ptie,sched) + Bf (f – 60) (1)
or
ACE = ΔPtie + BfΔf (2)
Where:
ΔPtie: The deviation in net tie-line powerflow out of the area from its scheduled value Ptie, sched.
Δf: The deviation of area frequency from its ratedvalue (60 Hz)
Bf: A frequency bias constant.
For this strategy I controller is conventionally used.However, in this project, the same strategy is used with I, PID and fuzzycontroller in area one by using Labview software to investigate whichcontroller can generate better performance.
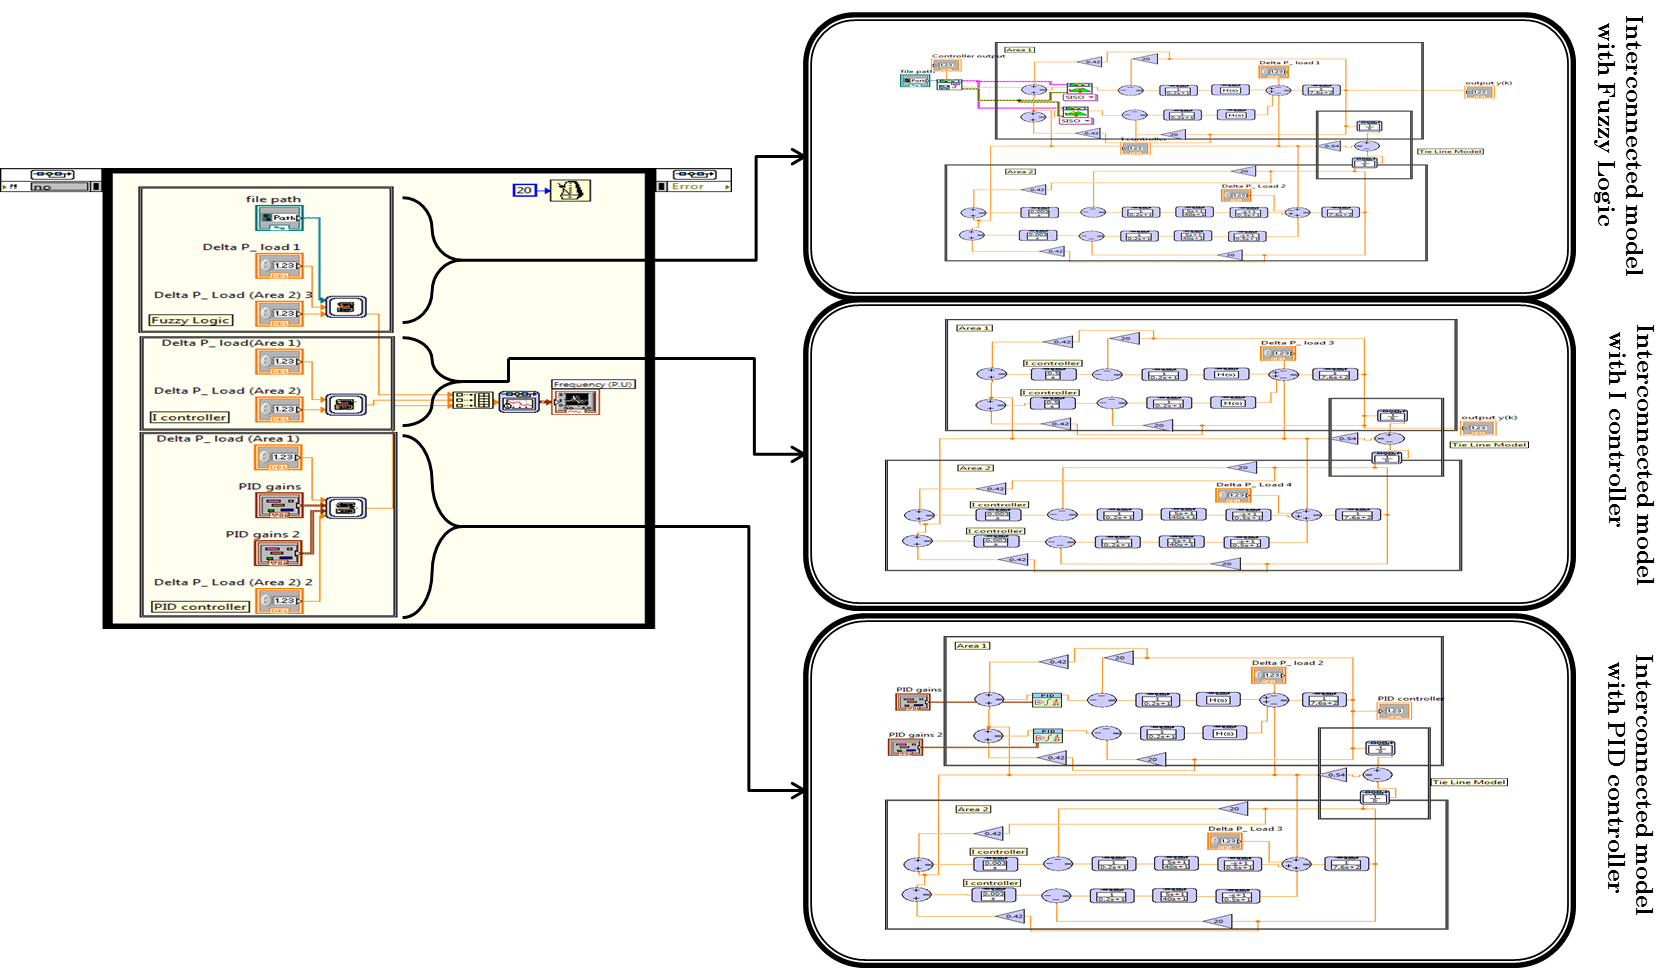
Figure10: The comparison simulation of an interconnected model in labviewsoftware
The fuzzy controller has single input and single output, which are defined as:
Input: error =ACE
Output: ΔPref
The triangular membership functions for the fuzzy controller are shown in figure 11. The defuzzification method is “center ofarea”. The fuzzy rules are:
1- If “ACE” is “NB” then “OUT” is PB
2- If “ACE” is “NS” then “OUT” is PS
3- If “ACE” is “Z” then “OUT” is Z
4- If “ACE” is “PS” then “OUT” is NS
5- If “ACE” is “PB” then “OUT” is NB
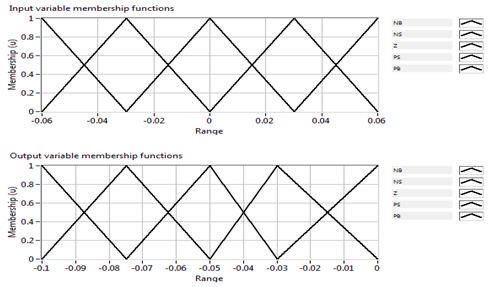
Figure11: Membership functions for the fuzzy controller (using Fuzzy system designer in Labview software)
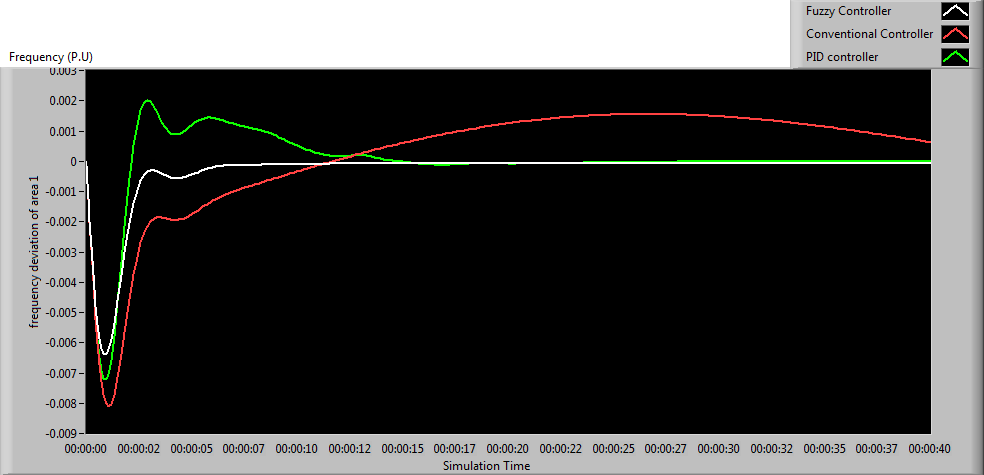
Figure12: simulation results (by Labview software)
During sudden increase in load (ΔPLOAD =0.1P.U). The result in figure 12 shown that, the performance of fuzzy controller is better than PID and conventional I controller.
Conclusions and future work:
In this work, dynamic behavior for an isolated andinterconnected power systems are investigated. For isolated system, PID controller was designed for improvement sensitivity of the system. Also a conventional I controller was applied to the system for comparison. The result shows that the PID controller yields much improved control performance whencompared to conventional I controller.
Fuzzy system designer in Labview software has beenused to design a fuzzy controller for an interconnected power system model.Additionally, Conventional I controller and PID controller was applied to the system for comparison. Summary of performance indices the result shows that the fuzzy controller has better performance characteristics as compared to the Iand PID controllers.
In term of future work:
Design a frequency and voltage response models,control structures and mathematical algorithms to adopt modern robust controltheorems with frequency/voltage issues. Implement modern control strategies tofrequency and voltage regulation problems. Investigate the fluctuation case by wind turbine when it’s connected to the electrical network. Introduce a predictive control strategy to power generation for electrical quality improvement.
References:
3. Kundur, P. Powersystem stability and control. New York : McGraw-Hill, 1994.
4. Andersson, Goran. Dynamicsand control of electrical power systems. Zurich : EidgenossischeTechnische Hochschule, 2010. Lecture 227-0528-00, ITET ETH.
Appendix:
The data oftypical example of isolated and interconnected models is given below:
Non-reheat steamturbine
TGV =0.2s , Tt = 0.3s , R = 2.4 Hz/pu MW
Reheat steamturbine
TGV =0.2s , FHP = 0.3 , TRH = 6s , TCH = 0.3s , R = 2.4 Hz/pu MW
Hydro turbine
TGV =0.2s , TW = 1.0s , RP = 0.05s , TR = 5s , RT = 0.4
Gas turbine:
X = 0.6 , Y = 1.0 , a = 1 , b = 0.05 , c = 1 , TF = 0.23s , TCR = 0.01s , TCD = 0.02s ,
Rg =2.4 Hz/pu MW
Tie line model
PT =0.086
Power system
Pr =2000 MW, D = 2 , M = 7.6 , fr = 60 Hz
Hello there,
Thank you so much for your project submission into the NI LabVIEW Student Design Competition. It's great to see your enthusiasm for NI LabVIEW! Make sure you share your project URL(https://decibel.ni.com/content/docs/DOC-16557) with your peers and faculty so you can collect votes for your project and win. Collecting the most "likes" gives you the opportunity to win cash prizes for your project submission. If you or your friends have any questions about how to go about "voting" for your project, tell them to read this brief document (https://decibel.ni.com/content/docs/DOC-16409). You have until July 15, 2011 to collect votes!
I'm curious to know, what's your favorite part about using LabVIEW and how did you hear about the competition? Great work!!
Good Luck, Liz in Austin, TX.
You spent too much time for this project. End of the day, It becomes perfect project. You deserve the BEST. Good luck.
Omer Damdelen
Good Luck dude 
moabrook ya gameel ... isa hateksab
