- Subscribe to RSS Feed
- Mark Topic as New
- Mark Topic as Read
- Float this Topic for Current User
- Bookmark
- Subscribe
- Mute
- Printer Friendly Page
Select the desired graph
Solved!09-25-2016 02:43 AM
- Mark as New
- Bookmark
- Subscribe
- Mute
- Subscribe to RSS Feed
- Permalink
- Report to a Moderator
Hi
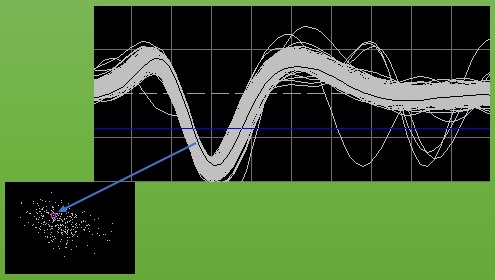
I have a challenge with multiple plot.
I want to select different plots in multiple plot when mouse is moved along them or along other xy graph that it is synced with it.
Similar to this :
Please help me.
Thank you
Solved! Go to Solution.
09-26-2016 10:48 AM
- Mark as New
- Bookmark
- Subscribe
- Mute
- Subscribe to RSS Feed
- Permalink
- Report to a Moderator
Hello M.H.K,
could you please specify a bit more in detail what is the 'challenge' for you?
If it is to find which XY-Value the mouse is hovering over then the following diagram might be a first step:
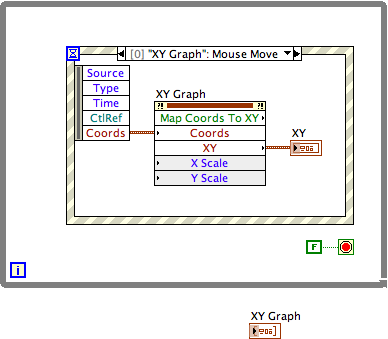
So, whithin a while loop that never stops, an event structure recognizes the mouse moving over the XY Graph.
1a. Create an event structure
1b. Right-click on the event structure, select 'Edit Events Handled by This Case'.
1c. select the XY Graph control in the middle list, then
1d. select 'Mouse / Mouse Move' in the right list of the 'Edit Events' window.
2. Create an Invoke Node by right-clicking on the XY Graph, select 'Create / Invoke Node / Map Coordinates To XY'. Wire as shown above.
3. Create the 'XY' indicator to see the xy value cluster where the mouse is actually hovering over the XY plot.
4. Place that code within a while loop with the conditional terminal wired as shown above.
5. Finally, run the program, move your mouse over the XY Graph, see the XY values indicated
As a second step, you would have to check whether the xy value of the mouse matches one of your plotted values. But before I develop all this code here, please specify your needs in detail first.
Uli
P.S. Your example looks like a spike sorter - neurophysiologists use such a tool to sort action potentials generated by different neurons within the recording of one single electrode. Is that what your tackling?
09-26-2016 03:48 PM
- Mark as New
- Bookmark
- Subscribe
- Mute
- Subscribe to RSS Feed
- Permalink
- Report to a Moderator
Hello ulricius and thank you for your reply.
After creation this post,I was trying about it and I achieve answer.
Please check attach and tell me your opinion about it and if you think that there is another way,don't hesitate to say it to me.
Also I have another question and I'm sure that you can help me.
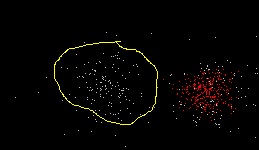
I have a xy graph contains a number of points and I want to select a part of them similar to ROI and their colors be changed and also, can select a number of ROI in that.
Like this :
Can you help me?
P.S. Your example looks like a spike sorter - neurophysiologists use such a tool to sort action potentials generated by different neurons within the recording of one single electrode. Is that what your tackling?
Your guess is correct. I'm tackling about it and I'm happy to receive your experiences and learn about it from you.
Hope to hear from you soon.
Thank you
09-27-2016 06:06 AM
- Mark as New
- Bookmark
- Subscribe
- Mute
- Subscribe to RSS Feed
- Permalink
- Report to a Moderator
Hello M.H.K.,
I am currently travelling. Since I have no LabVIEW development environment at hand here, I unfortunately can provide no example code before thursday. 😕
Maybe I can help a little:
Marking values by drawing a circle or else around them is actually taking two steps:
First, you will have to track (and draw) the mouse movement after the user started to mark values.
Second, you will have to select the subset of values that lie within the marked area.
The first step might be taken using dynamic events:
1a.: Use an event structure to let the program know when 'XY Graph: Mouse Down' happened.
1b.: Within that event case, register for 'XY Graph: Mouse Move' events.
2.: Use a dynamic 'XY Graph: Mouse Move' event to collect (and draw) all the pixels the user moved the mouse over when marking an area on the XY Graph.
3. If the dynamic event 'XY Graph: Mouse Move' is active and the user performed any 'Mouse Up', unregister from the mouse move event.
The second step is more tricky because you will have to define a 'Gestalt' - the area whithin the polygon that the user has drawn. Maybe the user did not draw a closed figure, maybe the figure has more than one crossing...
I will have to stop here, because it would mean to much discussion without the possibility to develop some example code. If you don't get along yourself until thursday, we might continue our challenge later!
Yours, Uli
09-27-2016 10:25 PM
- Mark as New
- Bookmark
- Subscribe
- Mute
- Subscribe to RSS Feed
- Permalink
- Report to a Moderator
09-28-2016 05:05 AM
- Mark as New
- Bookmark
- Subscribe
- Mute
- Subscribe to RSS Feed
- Permalink
- Report to a Moderator
Thank you ulricius and I'm waiting for your experiences.
09-28-2016 05:06 AM
- Mark as New
- Bookmark
- Subscribe
- Mute
- Subscribe to RSS Feed
- Permalink
- Report to a Moderator
Hi MikaeIH and thank you very much.
10-01-2016 11:08 AM
- Mark as New
- Bookmark
- Subscribe
- Mute
- Subscribe to RSS Feed
- Permalink
- Report to a Moderator
Dear M.H.K,
your problem challenged me a bit on this saturday afternoon.
Experience tells me your users will prefer to have the possibility to draw figures of any arbitrary shape and not be restricted to rectangles?
Like this:

The VI is saved in LabVIEW 2013. Earlier versions don't have some of the features that I used - I hope that's ok?
Next what you have to do is to find the values that lie within your figure. A tricky task, though.
But since that's not a LabVIEW issue, I'll leave that up to you and stop here 😉
Yours, ulricius
10-02-2016 01:53 PM
- Mark as New
- Bookmark
- Subscribe
- Mute
- Subscribe to RSS Feed
- Permalink
- Report to a Moderator
Hello ulricius and sorry for my late response.
It's perfect.Thank you very much.
You're right and I prefer to draw figure of shape freely around a number of points.
Of course I want to draw a number of figure of shape and after studying your program,I'll modify it for multi-draw.
Next what you have to do is to find the values that lie within your figure. A tricky task, though.
But since that's not a LabVIEW issue, I'll leave that up to you and stop here 😉
I want to select a number of points that those are a part of a feature space for detecting their spikes from others.
This corresponds to issue that you mentioned earlier
Thank you again.
