- Subscribe to RSS Feed
- Mark Topic as New
- Mark Topic as Read
- Float this Topic for Current User
- Bookmark
- Subscribe
- Mute
- Printer Friendly Page
Insert data into array from sensor
Solved!04-20-2012 01:12 AM
- Mark as New
- Bookmark
- Subscribe
- Mute
- Subscribe to RSS Feed
- Permalink
- Report to a Moderator
My first post! Firstly I would like to say that the people behind the LIFA Interface have done a great job! 
I'm new to Labview, but have worked on Arduino.
I'm using my Arduino to sense the current & volatge of a DC Shunt Motor using Hall Effect Sensors. I'm gettng this data in LabVIEW using LIFA, no problem till now. What I want to achieve is to plot the Current vs Voltage over a period of time (for the duration the motor is on). If I use the Express XY plot option, I get the plot but that is only for a small period, I need it over a longer period (around 30 mins). I'm reading the sensor twice every second, therfore around 3600 values per sensor, and there are 4 sensors.
Now I want to store this sensor data into an array and whenever the user presses a button, it takes the values from the array and plots it for the whole duration. I can't seem to figure out how to do this part. Would be glad if anyone could help.
Solved! Go to Solution.
04-20-2012 01:43 AM
- Mark as New
- Bookmark
- Subscribe
- Mute
- Subscribe to RSS Feed
- Permalink
- Report to a Moderator
To store, you just initialize the 2D array with proper dimentsions as required, and index your data in it or further you can store it in your pc (excel file) by using function "write to spreadsheet.vi" under File I/O.
Whenever you want to call back the stored data (in excel), you can use "read from spreadsheet.vi".
Hope this helps.
04-23-2012 01:31 AM
- Mark as New
- Bookmark
- Subscribe
- Mute
- Subscribe to RSS Feed
- Permalink
- Report to a Moderator
Thanks a lot gaurav! I'm trying out your method, will post back with results.
04-24-2012 05:19 AM
- Mark as New
- Bookmark
- Subscribe
- Mute
- Subscribe to RSS Feed
- Permalink
- Report to a Moderator
I tried the above method, writing the variables to an external file, I stored the variable in different files (as I have to use them in multiple places). Now I'm not able to plot them.
I'm using the "read from spreadsheet" function and Express XY plot. I'm able to get the plot for only one variable, lets call it Y1 vs X, whereas I need multiple plots with the same X axis, something like Y1 vs X, Y2 vs X, Y3 vs X, all in the same plot.
All these variables are stored in different files, X in 1 file, Y1 in one file and so on.
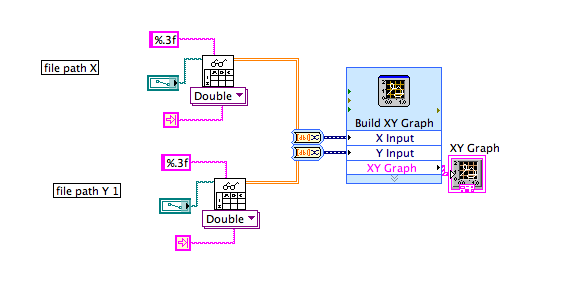
I've attached a picture of my VI which reads from the file. Please help me in plotting all the variables.
04-25-2012 07:10 AM
- Mark as New
- Bookmark
- Subscribe
- Mute
- Subscribe to RSS Feed
- Permalink
- Report to a Moderator
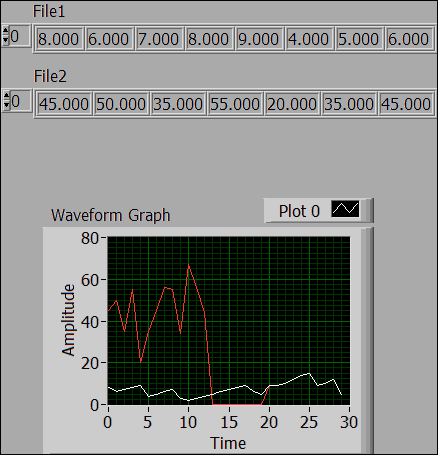
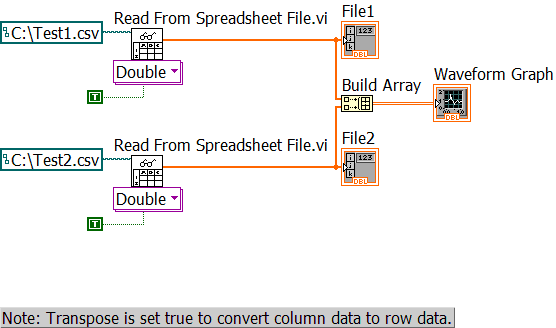
You need to modify your program as per the attached images. Considering you are plotting the first column of the excel files. Make two such files, fill in the data and sore them as .csv format in excel (Test1.csv and Test2.csv in my case).
Then do in following way. You will be able to plot both files data. As you can see File1 (plotted white) and File2 (plotted red).
Hope this helps. Good Luck !!
